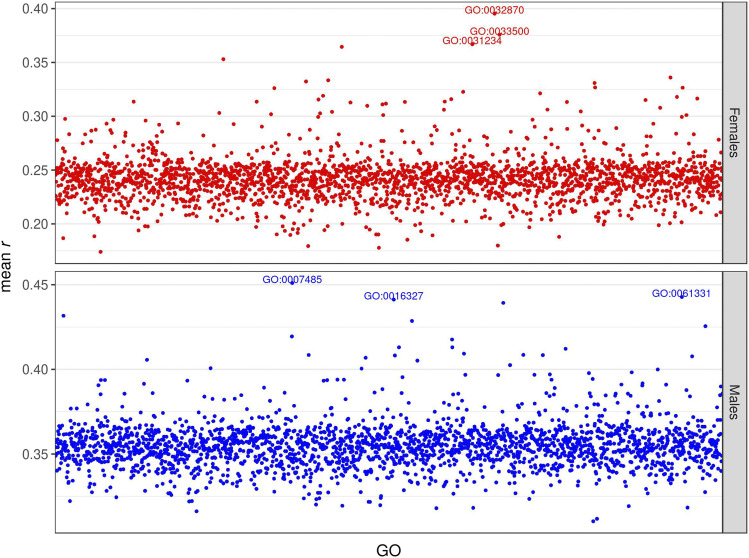
Figure 8.
Prediction accuracy for starvation resistance, measured as mean r (on the y-axis) in the test set, obtained by the GO-GTBLUP model. Each point represents the prediction accuracy achieved by a specific GO term; the top 3 most predictive GO terms are spelled out. The upper panel represents females, and the lower panel represents males.

