Figure 2.
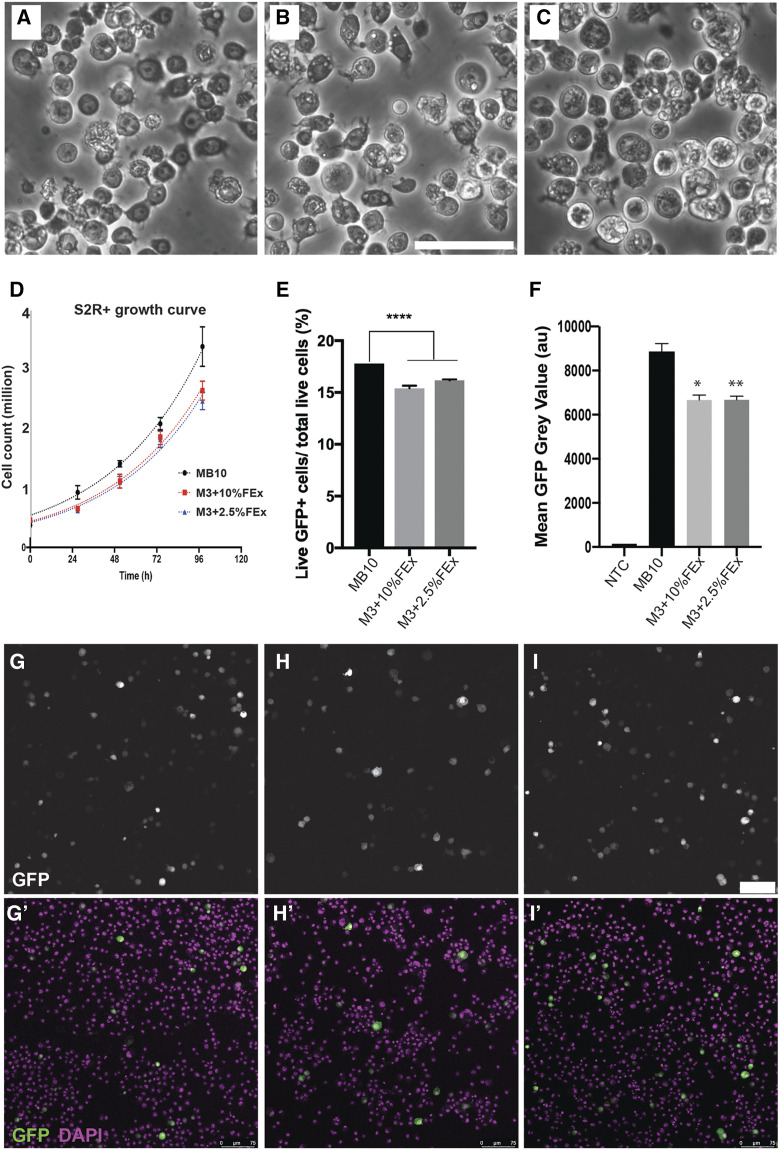
Properties of S2R+ cultures across three culture conditions. (A) The morphology of S2R+ cells grown in M3 + BPYE + 10% FBS (Control). (B) The morphology of S2R+ cells in M3 + 10% FEx. (C) The morphology of S2R+ cells in M3 + 2.5% FEx. Scale bar, 50 μm. (D) The growth curves of S2R+ grown in three distinct media as indicated. (E) A bar graph quantitating the transfection efficiency of S2R+ cells grown in three distinct media as determined by flow cytometry. (n = 3, **** denotes P < 0.0001). (F) A bar graph quantitating the GFP expression intensity of S2R+ cells grown in the three distict media as determined by flow cytometry. (n = 3, * denotes P = 0.0416 and ** denotes 0.0085, relative to MB10 control), NTC – non-transfected control. (G) Micrograph of S2R+ cells transfected with ptub-GAL4 and pUAS-GFP grown in control media, (H) M3 + 10% FEx and (I) M3 + 2.5% FEx. Scale bar, 75 μm. GFP expression labels cells harboring ptub-GAL4 and pUAS-GFP. DAPI marked the total cells.

