Figure 3.
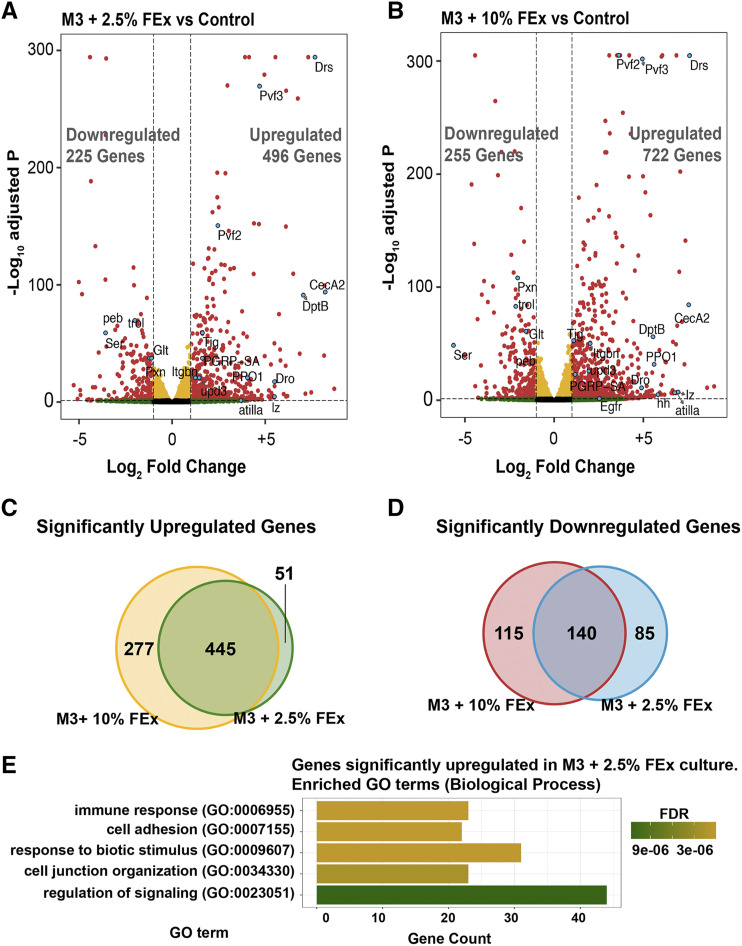
Differential gene expression in S2R+ cultures across three culture conditions. (A) Volcano plot of differentially expressed genes from comparison of cells cultured in M3 + 2.5% FEx to control or (B) M3 + 10% FEx to control. Each dot represents a single gene. Yellow indicates a false discovery rate adjusted p-value (FDR) < 0.05 and a Log2 fold change < 1 or > -1. Green indicates Log2 fold change > 1 or < -1 and an FDR >= 0.05. Red indicates an FDR < 0.05 and Log2 fold change > 1 or < -1. A select number of genes highlighted in cyan were discussed in the text. Venn diagram showing the overlap of (C) significantly upregulated (FDR < 0.05 and Log2 fold change > 1) or (D) significantly downregulated (FDR < 0.05 and Log2 fold change < -1) genes in M3 + 2.5% FEx and M3 + 10% FEx compared to control cultures. (E) Bar plot showing a selected set of significantly enriched Gene Ontology (GO) terms for genes that are significantly upregulated (adjusted P < 0.05 and log2 fold change > 1) in cells cultured in M3 + 2.5% FEx compared to control.

