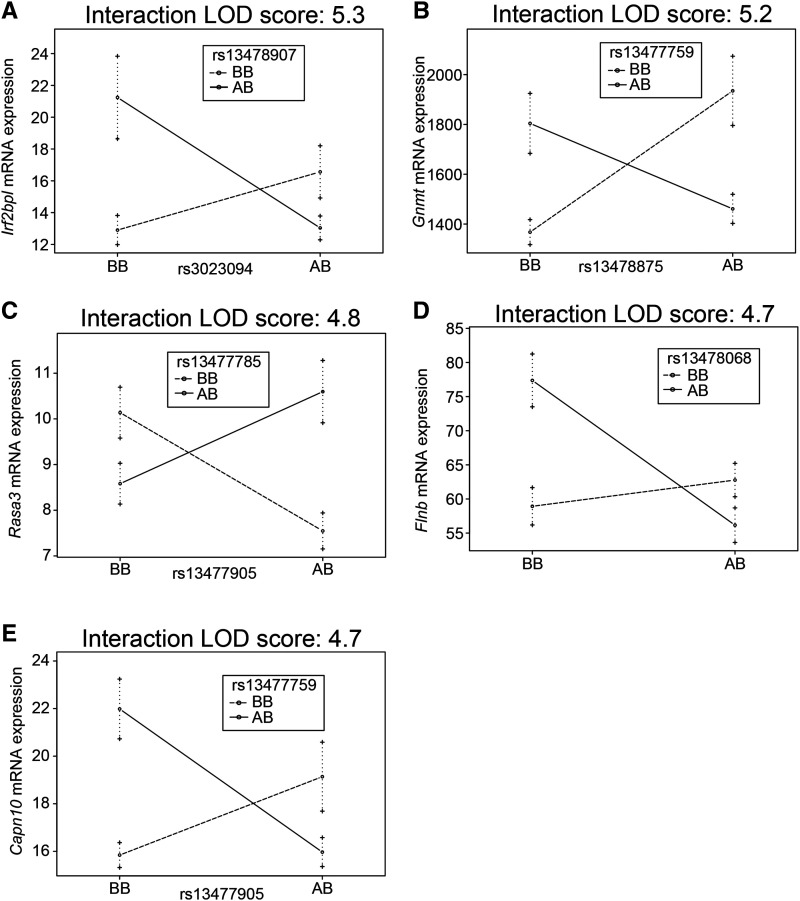
Figure 5.
Epistatic interactions control gene expression. Context dependent effects on gene expression for (A) Irf2bpl, (B) Gnmt, (C) Rasa3, (D) Flnb, and (E) Capn10. The y-axis represents the number of unique sequencing reads per gene after normalizing read depth across samples. Mean and standard error are shown for each genotype combination. An “A” genotype indicates A/J-derived. A “B” genotype indicates C57BL/6J-derived.

