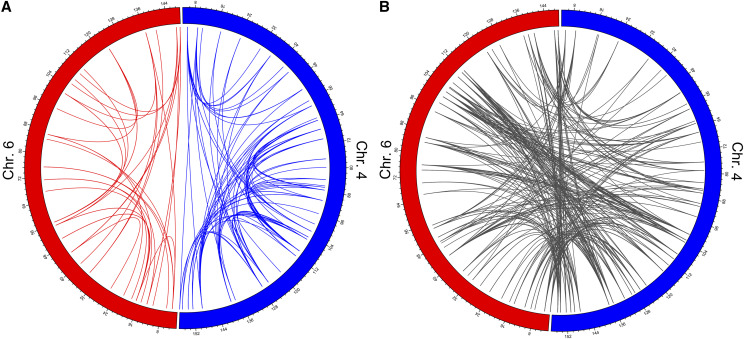
Figure 6.
Inter-chromosomal and intra-chromosomal epistatic interactions that control gene expression are widely distributed along chromosomes 4 and 6. (A) The circos plots illustrates the location along chromosomes 4 and 6 for the peak SNPs for all epistatic QTL pairs regulating gene expression. Chromosome 6 and the intra-chromosomal epistatic QTL pairs on that chromosome (n = 37) are shown in red. Chromosome 4 and the intra-chromosomal epistatic QTL pairs on that chromosome (n = 149) are shown in blue. Numbering around the circle plots indicates the Mb position on each chromosome. (B) Inter-chromosomal epistatic QTL pairs between chromosomes 4 and 6 (n = 333) are shown in gray.

