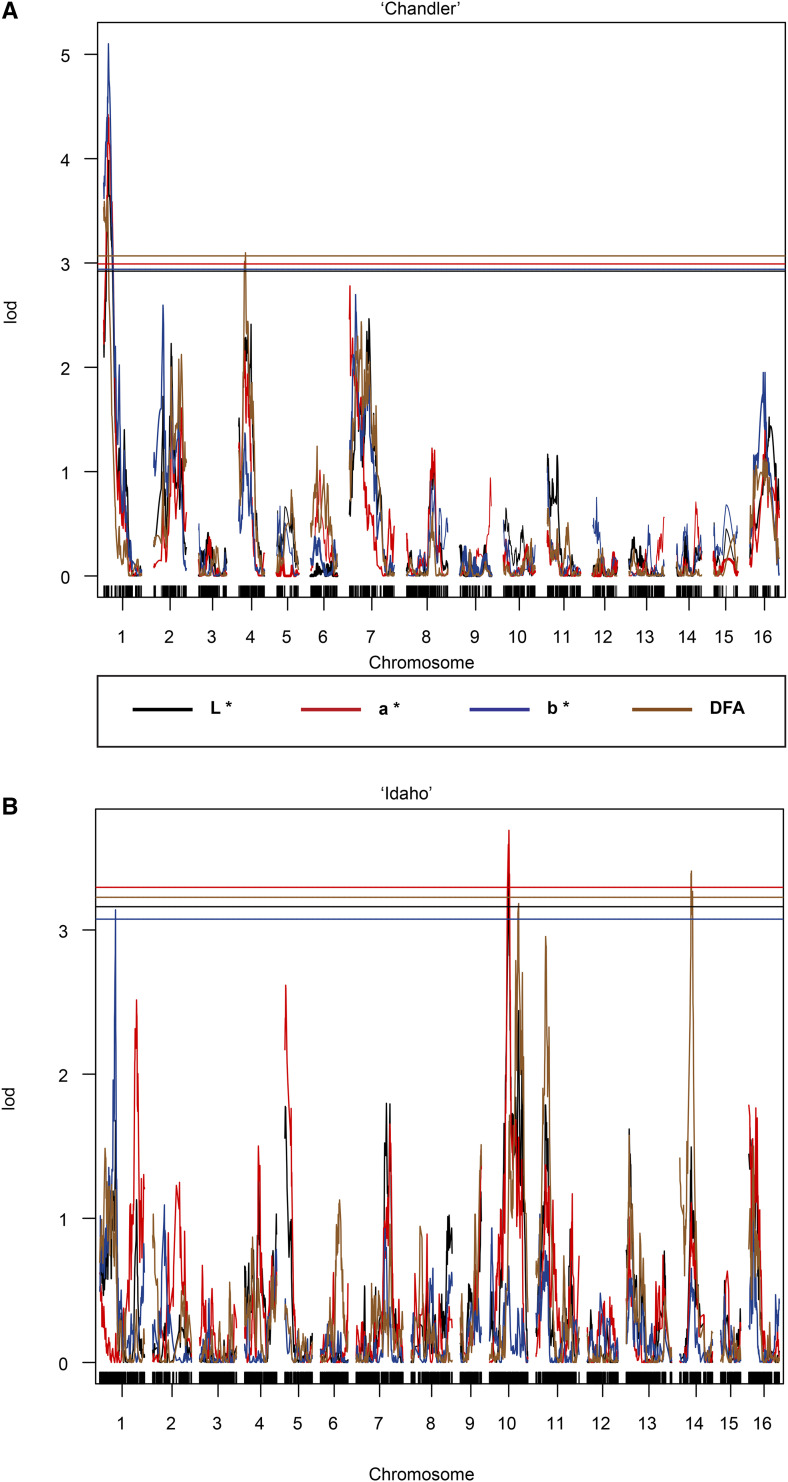
Figure 4.
Manhattan plots from QTL mapping of ‘Chandler’ × ‘Idaho’ population. A. SNPs segregating in the ‘Chandler’ population. QTL identified on Chr01 for L*, a*, DFA, scores detected two-year dataset, while b* only detected in 2017, and on Chr04 for the DFA score in both years. B. ‘Idaho’dataset contains QTL identified on Chr10 for L*, a*, and DFA averaged scores over 2016 and 2017, and QTL on Chr14 for the DFA score in 2017.

