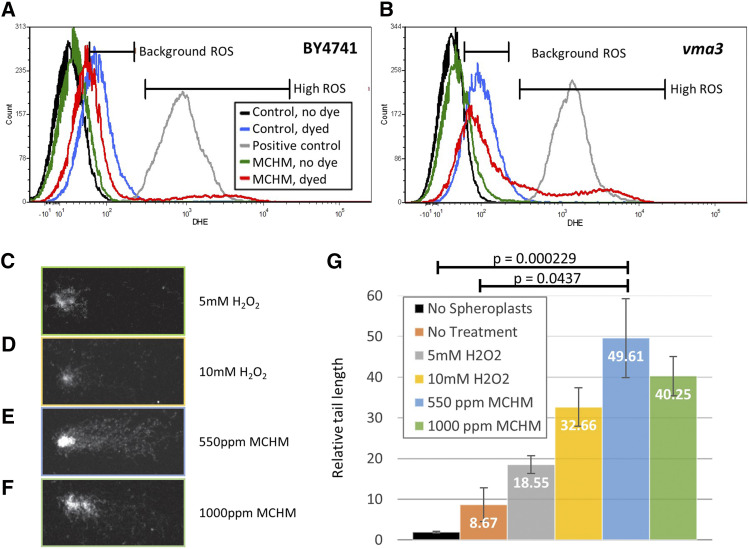
Figure 4.
Flow cytometry and comet assay of yeast strains reveals the production of Reactive Oxygen Species and DNA damage. Levels of ROS in strains of yeast exposed to MCHM, based on fluorescence of the ROS-reactive dye DHE. Yeast were incubated for 12 hr with or without MCHM then stained with DHE for 20 min before cells were sorted using flow cytometry. Hydrogen peroxide treatment for 1.5 hr was used as a positive control to generate ROS in control cells (gray line). Background ROS of untreated yeast in blue measures endogenous ROS compared to unstained yeast with no DHE (black). MCHM treated yeast are in green while MCHM treated yeast stained with DHE are in red. Markers were inserted on the histogram to indicate a range of fluorescence corresponding to background or high ROS based on peaks for untreated control cells. Histograms are for the strains A. BY4741, and B. vma3 knockout mutant. C-F. Examples of cells visualized by microscopy for the comet assay. Cells underwent treatment prior to spheroplasting, electrophoresis on a slide, and visualization via microscopy and ethidium bromide staining. Lengths of tails were measured with TriTek CometScore 2.0.0.38 software. The samples shown are examples of the following treatments C. 5mM H2O2, D. 10mM H2O2, E. 550ppm MCHM, and F. 1000ppm MCHM. G. Graph of tail lengths of cells determined via comet assay.

