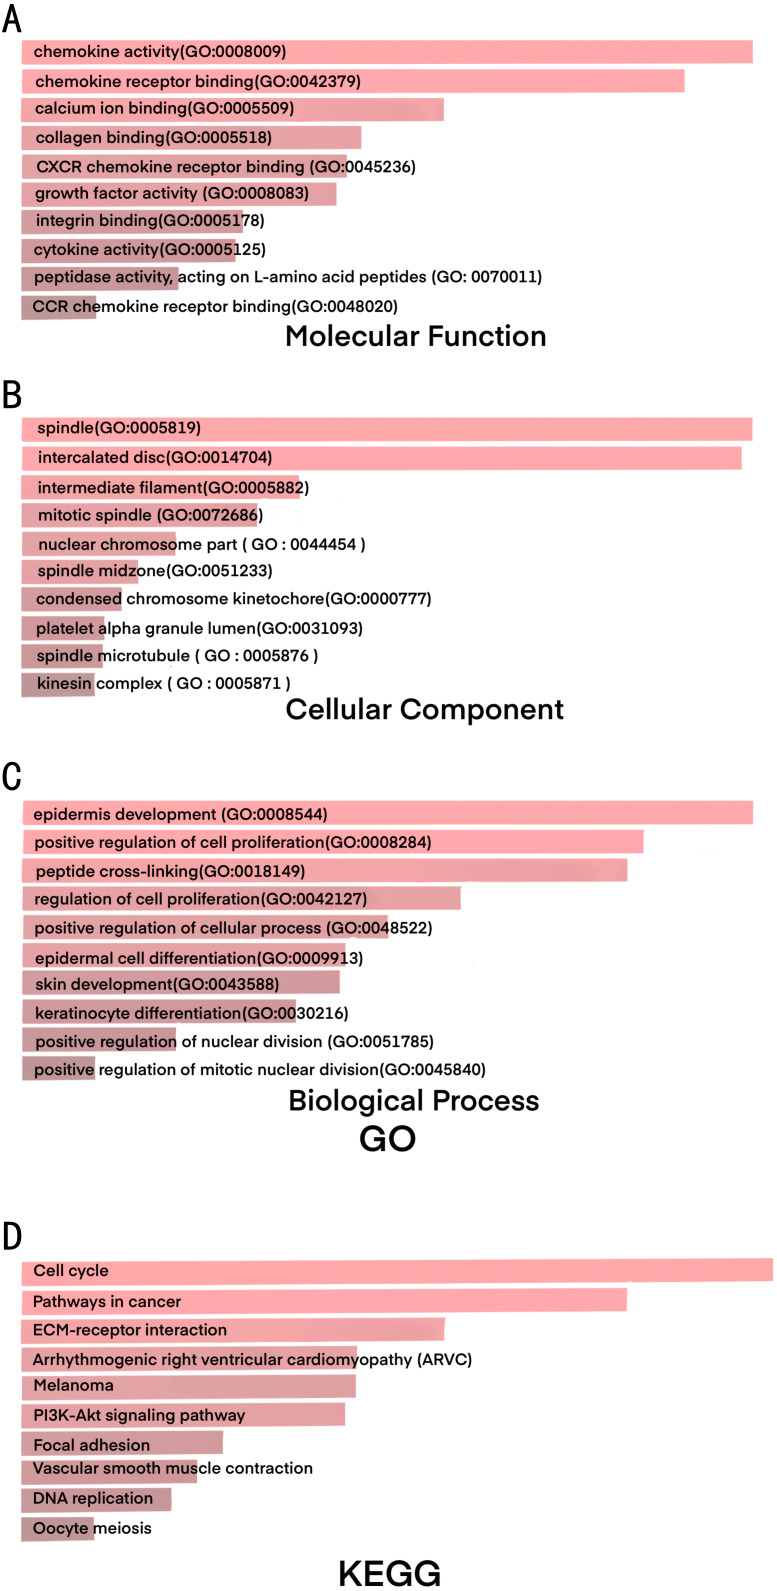
Figure 2. GO and KEGG results shows significant signaling pathways of DEGs.
(A) The results of GO analysis for pathways associated with molecular function (MF). (B) The results of GO analysis for pathways associated with cellular component (CC). (C) The results of GO analysis for pathways associated with biological process (BP). (D) The results of KEGG analysis.

