
Figure 3.
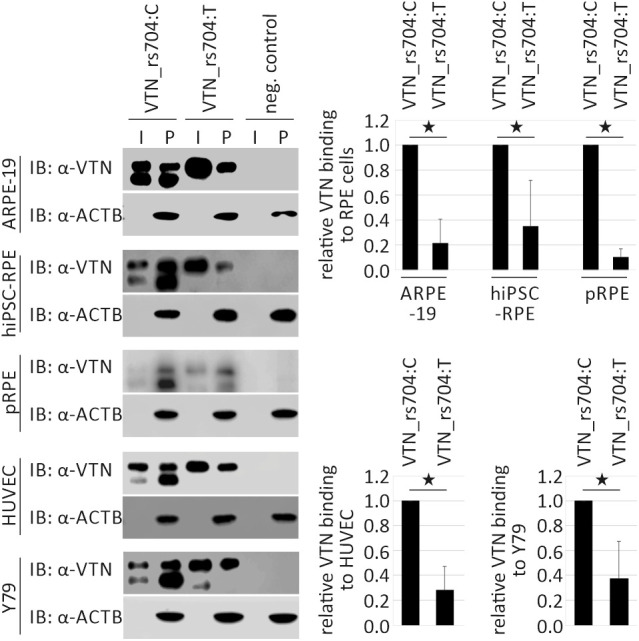
Binding capacity of vitronectin isoforms to different retinal and non-retinal cell lines. ARPE-19, hiPSC–RPE, porcine RPE (pRPE), HUVEC, and Y79 cells were incubated for 60 minutes with vitronectin-containing input (I, supernatants of HEK293 cells transfected with expression vectors for VTN_rs704:C and VTN_rs704:T, adjusted to obtain comparable concentrations of the vitronectin isoforms) or control input. Cells were then centrifuged and intensively washed. Vitronectin binding was assessed by subjecting cell pellets (P) to western blot analysis with antibodies against vitronectin. The ACTB immunoblot was performed as loading control. After densitometric quantification, vitronectin signals were normalized against ACTB and vitronectin in the input. Data represent the mean ± SD of four (hiPSC–RPE and pRPE), five (ARPE-19 and HUVECs), or six (Y79) biological replicates, calibrated against VTN_rs704:C. Asterisks indicate statistically significant differences (*P < 0.05, Mann–Whitney U test).