Figure 5.
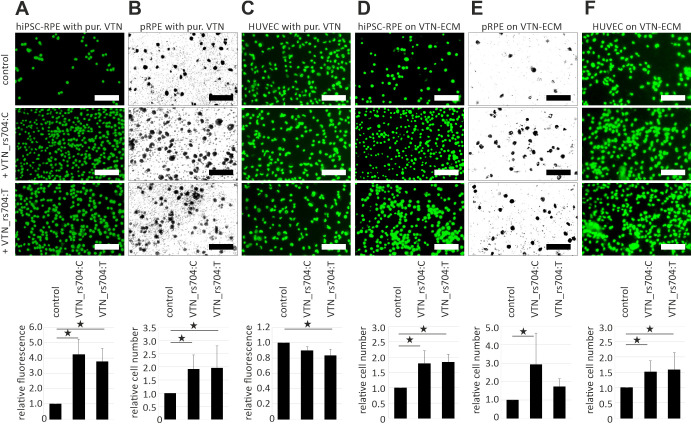
Effect of vitronectin isoforms on RPE and endothelial cell adhesion. (A) Suspended hiPSC–RPE cells, (B) freshly isolated porcine RPE cells (pRPE), or (C) HUVECs were incubated for 24 hours (A), 18 hours (B), or 20 minutes (C) in the presence of purified recombinant VTN_rs704:C, VTN_rs704:T, or control eluate. Subsequently, cell adhesion was determined measuring fluorescence of fluorescently labeled cells in a spectrophotometer (A, C) or counting cells from 4× micrographs (B) using ImageJ. (D) Suspended hiPSC–RPE cells, (E) freshly isolated pRPE, or (F) HUVECs were incubated for 40 minutes (D, E) or 5 minutes (F) on VTN_rs704:C- or VTN_rs704:T-containing ECM or on control ECM. Subsequently, adherent cells were determined by counting cells (fluorescently labeled in D and F) from 4× micrographs with ImageJ. Data represent mean ± SD of seven (A), four (B, E), or five (C, D, F) independent replicates, calibrated against the control. Asterisks indicate statistically significant differences (*P < 0.05, Kruskal–Wallis test, followed by Dunn's multiple comparison test and Bonferroni correction). Micrographs shown in the figure were taken at 10× magnification (standard, 200 µm).

