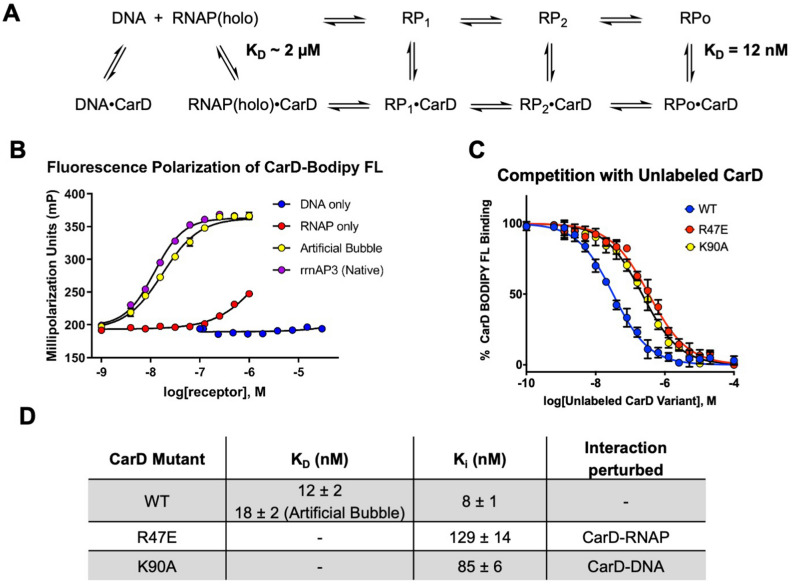
Figure 3.
Characterization and validation of CarD Fluorescence Polarization Assay. (A) Schematic of CarD binding partners with dissociation constants derived from (B). (B) FP of CarD-BODIPY-FL (3 nM) with RNAP and DNA. CarD shows essentially no binding to DNA at DNA concentrations up to 30 µM (data not shown). (C) Competition curve showing displacement of CarD-BODIPY-FL by WT and mutant CarD proteins (RNAP present at 1.25 × KD as determined in (B). (D) Summary of binding and inhibition constants as determined using Eq. (5).

