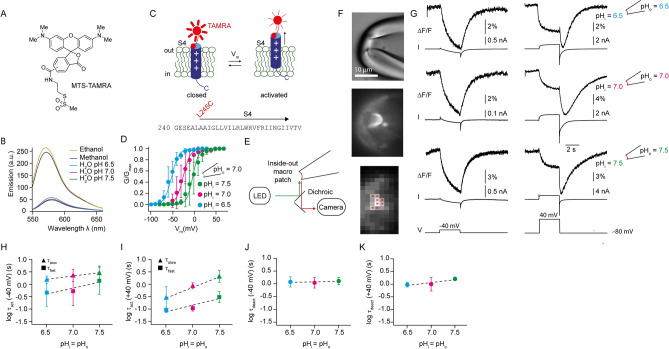
Figure 2.
PCF recordings at the extracellular end of S4 for different symmetric pH conditions. (A) chemical structure of MTS-TAMRA. (B) emission spectrum of MTS-TAMRA (50 nM) in ethanol, methanol, and aqueous solutions buffered to various pH values. Excitation wavelength was 542 nm. (C) top, cartoon depicting voltage-evoked S4 conformational change of ciHv1-L245C-TAMRA. For clarity, only S4 is shown. “ + ” signs denote the charged arginines in S4. Bottom, amino-acid sequence of the S4 voltage sensor of ciHv1 and the site of labeling. (D) GVs derived from tail currents of inside-out patch-clamp recordings of ciHv1-L245C-TAMRA at different ∆pH conditions, fitted with Boltzmann functions (see Table 1 for fit parameters). (E) scheme of the inside-out PCF recording condition. (F) excised inside-out patch containing ciHv1-L245C-TAMRA (top, bright-field image; middle, epifluorescent image; bottom, 8 × 8-binned epifluorescent image). Red stars mark pixels included in analysis. (G) representative inside-out PCF recordings of ciHv1-245C-TAMRA, in response to voltage steps from − 80 to − 40 (left) or + 40 mV (right) at different pH conditions leaving ∆pH = 0. The fluorescence (∆F/F) is the spatial average of the pixel intensities of the marked pixels as exemplified in panel F (bottom, see Methods). (H–I), mean activation time constants τfast and τslow of Fsignal at − 40 mV (panel H) or + 40 mV (panel I) as a function of pH (see also Table 3). The dashed lines are linear fits with the following slopes: slope(τfast) = 0.5 log(s)/pH unit, r2 = 0.2, n.s., and slope(τslow) = 0.3 log(s)/pH unit, r2 = 0.1, n.s., at − 40 mV; slope(τfast) = 0.5 log(s)/pH unit, r2 = 0.6, p < 0.05 and slope(τslow) = 0.9 log(s)/pH unit, r2 = 0.5, p < 0.05, at + 40 mV. (J–K) mean deactivation time constants τdeact of FSignal during repolarization from − 40 mV (panel J) or + 40 mV (panel K) to − 80 mV as function of pH (see also Table 3). The dashed lines are linear fits with the following slopes: slope(τdeact) = 0.03 log(s)/pH unit, r2 = 0.005, n.s., for − 40 mV; slope(τdeact) = 0.2 log(s)/pH unit, r2 = 0.3, n.s., for + 40 mV. Error bars indicate the SD.

