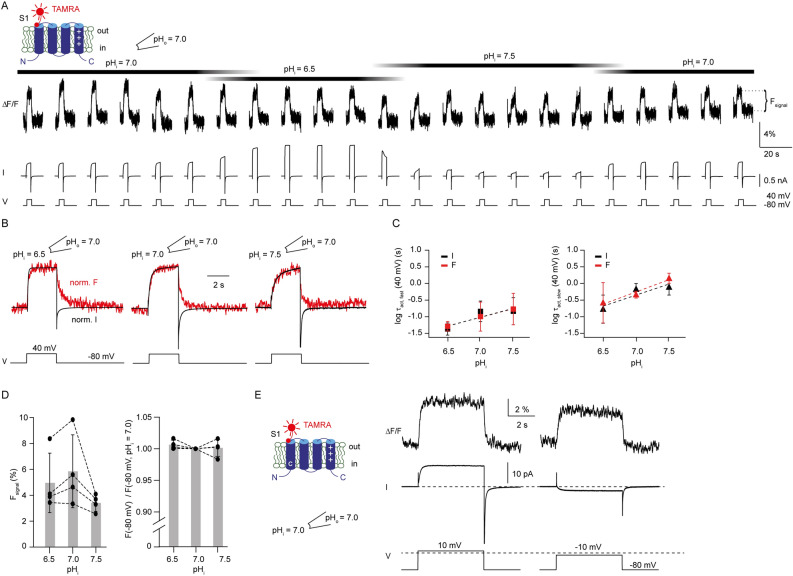
Figure 6.
Changes in pHi do not uncouple gating from S1 motion. (A) representative inside-out PCF recording of ciHv1-I175C-TAMRA in response to repetitive voltage steps from − 80 mV to + 40 mV and back while changing pHi and keeping pHo = 7.0. (B) overlay of normalized mean current and fluorescence derived from the recording in (A). (C) mean fast (left) and slow (right) activation time constants of current (black) and Fsignal (red) of ciHv1-I175C-TAMRA as function of pHi while pHo = 7 (see also Table 4). The dashed lines are linear fits with the following slopes: slope(τI fast) = − 0.5 log(s)/ΔpH unit, r2 = 0.3, n.s.; slope(τF fast) = − 0.5 log(s)/ΔpH unit, r2 = 0.4, p < 0.05; slope(τI slow) = − 0.67 log(s)/ΔpH unit, r2 = 0.5, p < 0.05; slope(τF slow) = − 0.73 log(s)/ΔpH unit, r2 = 0.5, p < 0.05; slope(τI fast) vs. slope(τF fast), n.s.; slope(τI slow) vs. slope(τF slow), n.s. (D) left, amplitude of Fsignal as a function of pHi while pHo = 7.0 (n = 4 patches from 4 different cells). For pHi = 6.5, Fsignal = 5.0 ± 2.3; for pHi = 7.0, Fsignal = 5.8 ± 2.8; for pHi = 7.5, Fsignal = 3.4 ± 0.6; one-way ANOVA, p = 0.3. Right, baseline fluorescence at − 80 mV (F(− 80 mV)) for different pHi while pHo = 7.0, normalized to F(− 80 mV) for pHi = 7.0 (n = 4 patches from 4 different cells). For pHi = 6.5, F(− 80 mV) = 1.006 ± 0.007; for pHi = 7.5, F(− 80 mV) = 1.001 ± 0.013; one-way ANOVA, p = 0.5. (E) representative inside-out PCF recording of ciHv1-I153C-I175C-TAMRA in response to voltage steps from − 80 to + 10 (left) or − 10 mV (right). Dashed line at the bottom indicates 0 mV. Error bars indicate SD.

