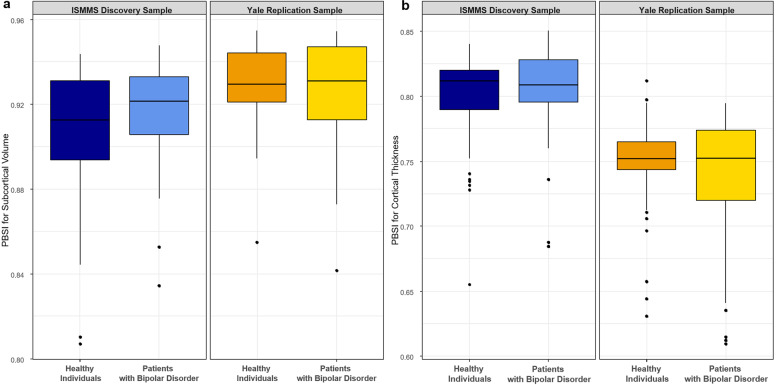
Fig. 3. Person-based similarity index (PBSI) in bipolar disorder.
a Subcortical volume; b cortical thickness. There were no significant case–control differences in either PBSI scores. The center line of the boxplot displays the median PBSI score, the bounds of the box show the 25th and 75th percentiles, the upper whisker is the maximum value of the data that is within 1.5 times the interquartile range over the 75th percentile. The lower whisker is the minimum value of the data that is within 1.5 times the interquartile range under the 25th percentile.

