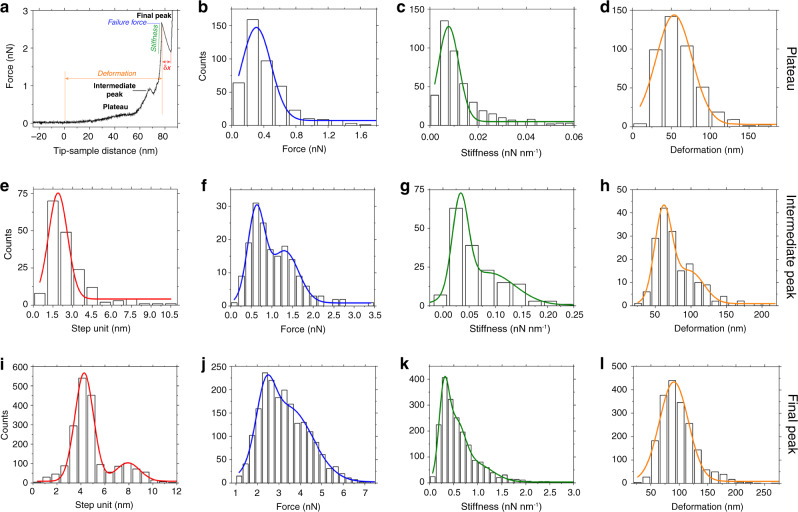
Fig. 2. Mechanical characteristics of lamin filaments.
a An FE curve showing a characteristic plateau and an intermediate peak preceding the final peak at high force (≈3 nN). b The plateau occurred at a force of 0.30 ± 0.20 nN (average ± standard deviation calculated from FWHM). c The region showed a stiffness of 0.0078 ± 0.0043 nN nm−1 (n = 432, n is the number of single events), and d a deformation of 54 ± 23 nm (n = 432). e The step unit of the intermediate peak was 1.9 ± 0.7 nm at a force of 0.60 ± 0.20 nN (n = 175) (f). g A stiffness of 0.033 ± 0.015 nN nm−1 (n = 172) was fivefold more than that of the structural intermediate at the plateau. h A deformation of 61 ± 12 nm (n = 173) was marginally larger than that at the plateau. The shoulders in the histograms, f force (1.3 ± 0.30 nN), g stiffness (0.086 ± 0.050 nN nm−1), and h deformation (98 ± 20 nm) indicate a continuum of the stiffening process. i Step unit histograms (4.3 ± 0.80 nm; 7.9 ± 1.0 nm; n = 1946); j failure force (2.4 ± 0.40 nN; 3.5 ± 1.1 nN; n = 1946); k stiffness (0.30 ± 0.11 nN nm−1; 0.54 ± 0.19 nN nm−1; 0.95 ± 0.34 nN nm−1; n = 1946); and l deformation (91 ± 26 nm; n = 1946) of the final peak data pooled from all speeds (Supplementary Fig. 10).

