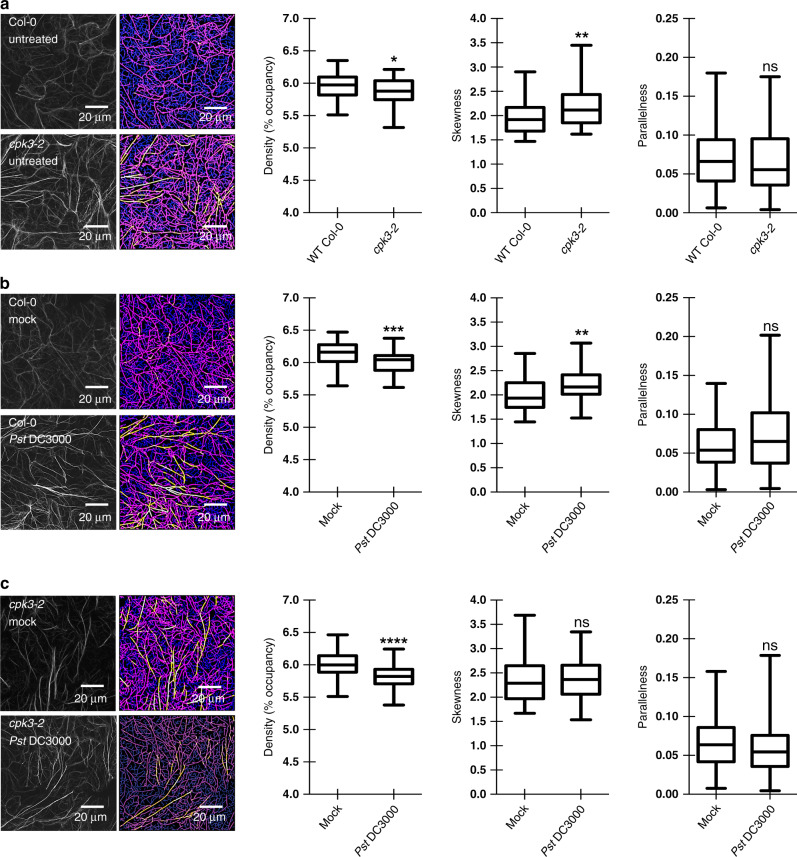
Fig. 3. CPK3 activity modulates ETI- and PTI-induced changes in actin cytoskeletal organization.
Quantitative analysis of actin cytoskeletal organization in epidermal pavement cells from a untreated WT Col-0 and the cpk3-2 mutant, mock and Pst DC3000-inoculated b WT Col-0 and the cpk3-2 mutant, and c flg22-elicited WT Col-0 and the cpk3-2 mutant. Representative confocal images (left) and skeletonized images for quantitative evaluation (right) are shown. Images were collected from ≥75 cells. Experiments were performed three times from multiple, independent, biological replicates. The box and whiskers plots represent minimum and maximum values. The line in the box plot represents the median value and the boundaries demonstrate the 25th percentile (upper) and the 75th percentile (lower). The statistics is performed with two tailed Mann–Whitney U-test; *p-value < 0.05; **p-value < 0.01; ns, ***p < 0.001; ****p < 0.0001; ns, not significant.

