
Fig. 1.
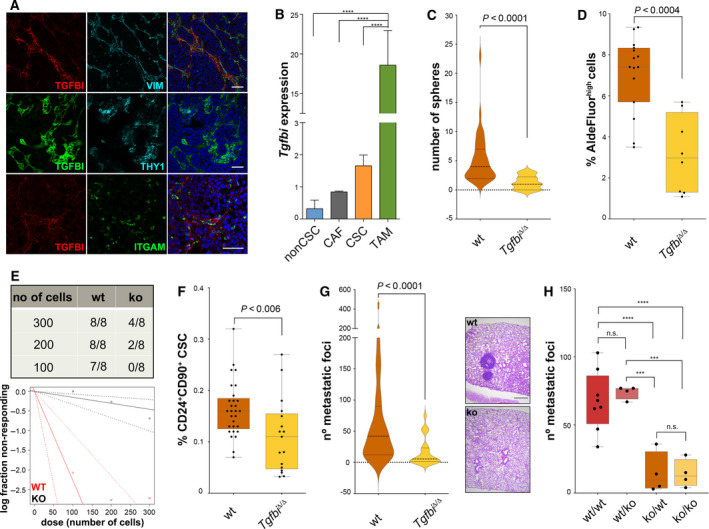
TGFBI and CSC potential. (A) Immunofluorescent staining for TGFBI, VIM, THY1 (CD90) and ITGAM (CD11b) in MMTV‐PyMT tumour sections. Scale bars, 50 μm. (B) qPCR analyses on FACS‐sorted Lin−CD24+CD90− (nonCSC, n = 4), Lin−CD24−CD90+ (CAF, n = 2), and Lin−CD24+CD90+ (CSC, n = 4), or MACS‐sorted CD11b+ cells (TAM, n = 4) from fresh MMTV‐PyMT tumours showed differences in Tgfbi expression. Data were analysed using one‐way ANOVA followed by Fisher's LSD test, and are presented as mean and SD (n = 4 independent tumours); Actb was used as a housekeeping gene. (C) Tumour cells were obtained from fresh MMTV‐PyMT;Tgfbi +/+ and MMTV‐PyMT;Tgfbi Δ/Δ tumours, grown overnight in collagen‐coated plates, and seeded as spheres (104 cells/well). Spheres were counted 10 days later. Data were analysed by Mann–Whitney test and are presented as a violin plot showing the median and the quartiles (n = 4 wt, n = 2 ko independent tumours). (D) Cells from fresh MMTV‐PyMT;Tgfbi +/+ and MMTV‐PyMT;Tgfbi Δ/Δ tumours were analysed by FACS using the AldeFluor assay. Data were analysed by Mann–Whitney test (n = 15 wt, n = 8 ko). (E) MMTV‐PyMT;Tgfbi +/+ and MMTV‐PyMT;Tgfbi Δ/Δ tumours were digested; tumour cells were counted and injected orthotopically in limiting dilution assays in FVB/N mice. The presence or absence of tumours was evaluated for a maximum of 3 months after injection. Data were analysed using ELDA (P = 1.61e−08). (F) Cells from fresh MMTV‐PyMT;Tgfbi +/+ and MMTV‐PyMT;Tgfbi Δ/Δ tumours were analysed by FACS for their expression of CD24 and CD90. Data were analysed by Mann–Whitney test (n = 29 wt, n = 17 ko). (G) Number of metastatic foci in the lungs of MMTV‐PyMT;Tgfbi +/+ and MMTV‐PyMT;Tgfbi Δ/Δ mice. Data were analysed by Mann–Whitney test and are presented as a violin plot showing the median and the quartiles (n = 55 wt, n = 17 ko). Representative haematoxylin–eosin staining of MMTV‐PyMT;Tgfbi +/+ and MMTV‐PyMT;Tgfbi Δ/Δ lungs (scale bar 500 μm). (H) Number of metastatic foci in the lungs of wt and ko FVB/N mice injected with 5 × 10⁵ MMTV‐PyMT;Tgfbi +/+ and MMTV‐PyMT;Tgfbi Δ/Δ tumour cells. Data were analysed using one‐way ANOVA followed by Fisher's LSD test (n = 8 wt/wt, n = 4 wt/ko, n = 4 ko/wt, n = 4 ko/ko). CSC, cancer stem cell; CAF, cancer‐associated fibroblast; TAM, tumour‐associated macrophage. ***P < 0.001; ****P < 0.0001; n.s., not significant.