Fig. 2.

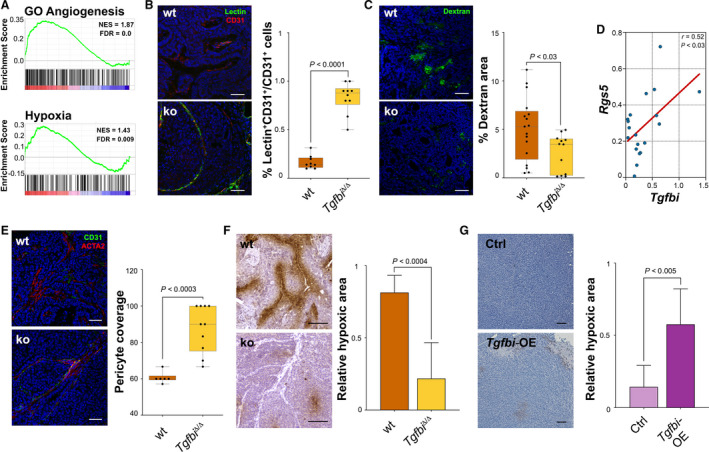
TGFBI depletion normalises the tumour vasculature. (A) Enrichment score analyses of RNAseq data obtained from MMTV‐PyMT;Tgfbi +/+ and MMTV‐PyMT;Tgfbi Δ/Δ tumours (n = 5) for GO angiogenesis and hallmark hypoxia. (B) MMTV‐PyMT;Tgfbi +/+ and MMTV‐PyMT;Tgfbi Δ/Δ mice were injected via tail vein with 100 μg of tomato lectin, and tumours were embedded in OCT and costained with CD31 (scale bar 100 μm). Data were analysed by unpaired t‐test. (C) MMTV‐PyMT;Tgfbi +/+ and MMTV‐PyMT;Tgfbi Δ/Δ mice were injected via tail vein with 50 μg of 70 kDa FITC‐labelled dextran, and tumours were embedded in OCT (scale bar 100 μm). Data were analysed by unpaired t‐test. (D) Tgfbi and Rgs5 expression correlation in MMTV‐PyMT tumours. The expression of both genes was determined by qPCR. The correlation was estimated by Pearson's r coefficient (n = 19). Rplp0 was used as a housekeeping gene. (E) Immunofluorescent staining of MMTV‐PyMT;Tgfbi +/+ and MMTV‐PyMT;Tgfbi Δ/Δ tumours with CD31 and ACTA2. Data were analysed by unpaired t‐test. (F) PIMO staining of MMTV‐PyMT;Tgfbi +/+ and MMTV‐PyMT;Tgfbi Δ/Δ tumours and quantification of stained area (scale bar 100 μm). Data were analysed by unpaired t‐test on two independent tumours, and are presented as mean and SD. (G) PIMO staining of MDA‐MB‐453 control and Tgfbi‐overexpressing tumours and quantification of stained area (scale bar 100 μm). Data were analysed by unpaired t‐test, and are presented as mean and SD (n = 3 ctrl tumours, n = 4 overexpression tumours). PIMO, pimonidazole.
