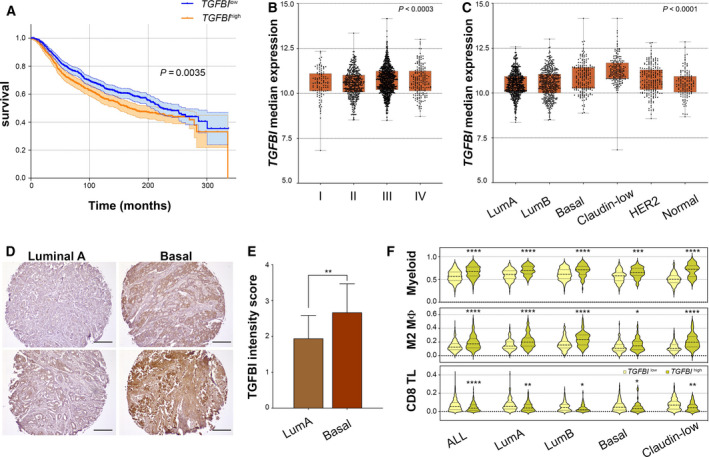
Fig. 4.

TGFBI is associated with poor prognosis. (A) Survival curves of breast cancer patients in the METABRIC cohort classified according to the expression of TGFBI (n high = 620; n low = 803). Patients were stratified using the application Evaluate cutpoints, and the survival curves were compared using the log‐rank (Mantel–Cox) test. Only ‘living’ and ‘died of disease’ patients were included in the analysis. (B) TGFBI expression in the METABRIC cohort classified according to the Nottingham prognostic index (n I = 108, n II = 452, n III = 1064, n IV = 191). Results were analysed using the Kruskal–Wallis test. (C) TGFBI expression of breast cancer patients in the METABRIC cohort classified according to the molecular subtype (n LumA = 679, n LumB = 461, n Basal = 199, n Claudin‐low = 199, n HER2 = 220, n Normal = 140). Results were analysed using the Kruskal–Wallis test followed by Dunn's multiple comparison test (LumA vs. LumB n.s., LumA vs. Basal P < 0.0001, LumA vs. Claudin‐low P < 0.0001, LumA vs. HER2 P < 0.0003, LumA vs. Normal n.s., LumB vs. Basal P < 0.0001, LumB vs. Claudin‐low P < 0.0001, LumB vs. HER2 P < 0.02, LumB vs. Normal n.s., Basal vs. Claudin‐low P < 0.0001, Basal vs. HER2 n.s., Basal vs. Normal P < 0.002, Claudin‐low vs. HER2 P < 0.0001, Claudin‐low vs. Normal P < 0.0001, HER2 vs. Normal n.s.) (D) Representative immunohistochemistry stainings for TGFBI in luminal A and basal‐like human breast tumours. (E) TGFBI IHC scoring according to the staining's intensity. Data was analysed using an unpaired t‐test, and are presented as mean and SD (n = 18 luminal A tumours, n = 22 basal‐like tumours). (F) Relative myeloid cell, M2 macrophage, and CD8 T‐cell content of TGFBI l ow (< 75th percentile) and TGFBI high tumours (≥ 75th percentile) in METABRIC tumours unclassified and classified by molecular subtype. The relative cell content estimation was calculated with cibersort. The data were analysed using either unpaired Student's t‐tests or Mann–Whitney's nonparametric tests, and they are presented as violin plots showing the median and the quartiles. *P < 0.05; **P < 0.01; ***P < 0.001; ****P < 0.0001; n.s., not significant.
