Fig. 1.

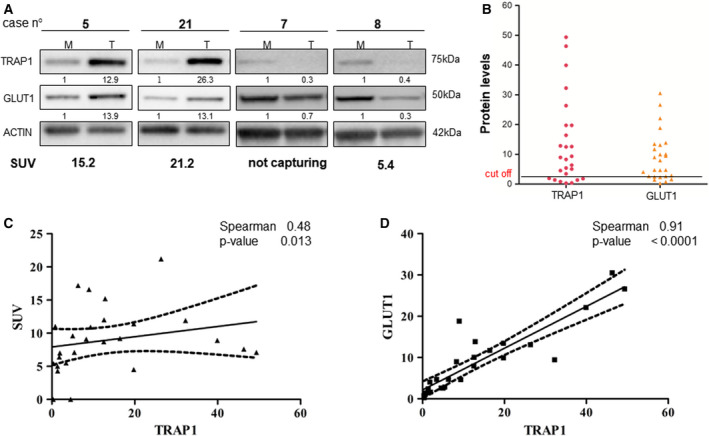
TRAP1 expression correlates with GLUT1 levels and 18F‐FDG uptake in human colorectal carcinomas. (A) TRAP1 and GLUT1 immunoblot analysis in four representative cases of human CRCs. (B) TRAP1 and GLUT1 protein levels in the cohort of 26 human CRCs. (C, D) Scatter plots representing the statistical correlation between TRAP1 and SUV upon 18F‐FDG PET scan (C) or GLUT1 expression (D) in the cohort of 26 human CRCs.
