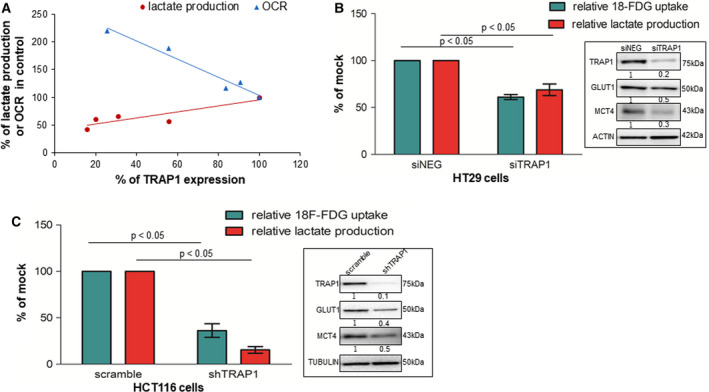
Fig. 2.

TRAP1 regulates the balance between glycolytic and oxidative metabolism in human CRC cell lines. (A) Plot representing the relationship between TRAP1 expression levels and lactate production or mitochondrial oxygen consumption rate (OCR). Results are plotted from independent siTRAP1 preparations with different efficiency of protein expression and are expressed as percentage of the corresponding Mock control. (B) Relative lactate production and 18F‐FDG uptake in transient TRAP1‐silenced HT29 cells. The Mann–Whitney test was used to establish the statistical significance. siNEG vs siTRAP1,18F‐FDG uptake: P < 0.05, lactate production: P < 0.05. (C) Relative lactate production and 18F‐FDG uptake in stable TRAP1‐silenced HCT116 cells. The Mann–Whitney test was used to establish the statistical significance scramble vs shTRAP1 18F‐FDG uptake: P < 0.05, lactate production: P < 0.05. (B, C) Inserts: TRAP1, GLUT1, and MCT4 immunoblot analysis in, respectively, TRAP1‐silenced HT29 (B) and HCT116 (C) cells.
