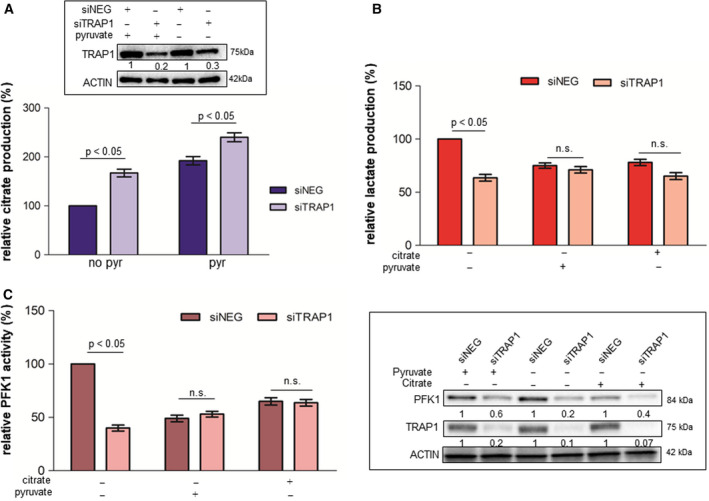
Fig. 5.

TRAP1 regulation of PFK1 and glycolytic metabolism depends on citrate production. (A) Citrate concentration in TRAP1‐silenced HCT116 cells cultured in standard medium (no pyruvate) or supplemented with 10 mm pyruvate for 6 h. (B, C) Relative lactate production (B) and PFK1 activity (C) in TRAP1‐silenced HCT116 cells cultured in standard medium (no pyruvate), or supplemented with 10 mm pyruvate or 1 mm citrate for 6 h. Insert: PFK1 and TRAP1 immunoblot analysis in TRAP1‐silenced HCT116 cells cultured in standard medium (no pyruvate) or supplemented with 10 mm pyruvate or with 1 mm citrate for 6 h. Graphs represent mean ± SD of three experiments. The Mann–Whitney test was used to establish the statistical significance between two groups (P < 0.05). (A) ANOVA test: P = 0.0005; Bonferroni post hoc test: no pyr: P < 0.05, pyr: P > 0.001; pyr+UK5099: P < 0.001. (B) ANOVA test: P = 0.003; Bonferroni post hoc test: no pyr: P < 0.01; pyr: P > 0.05; pyr+UK5099: P < 0.05. (C) ANOVA test: P = 0.0027; Bonferroni post hoc test: no pyr: P < 0.001; pyr: P > 0.05; pyr+UK5099: P < 0.001.
