Fig. 7.

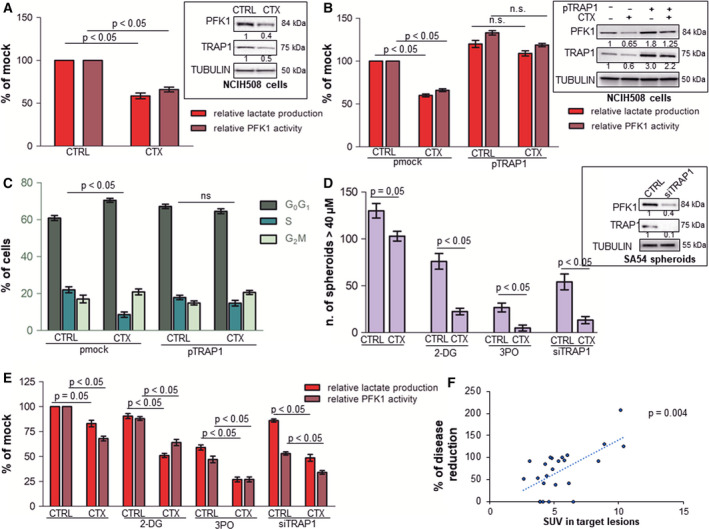
High TRAP1 expression and glycolytic metabolism correlate with poor response to cetuximab in vitro and in vivo. A. Relative lactate production and PFK1 activity in RAS‐wild‐type NCIH508 cells incubated with 17 nm cetuximab for 15 h. Insert: PFK1 and TRAP1 immunoblot analysis in NCIH508 cells incubated with 17 nm cetuximab for 15 h. (B, C) Relative lactate production and PFK1 activity (B) and cell cycle distribution (C) in NCIH508 cells transfected with TRAP1 cDNA and incubated with 17 nm cetuximab for 15 h. (B) Insert: PFK1 and TRAP1 immunoblot analysis in NCIH508 cells transfected with TRAP1 cDNA and incubated with 17 nm cetuximab for 15 h. (D, E) Number of spheroid (D), relative lactate production and PFK1 activity (E) in RAS‐wild‐type patient‐derived CRC spheroids (SA54 cells) incubated with 680 nm cetuximab, 10 μm 2DG, 10 μm 3PO for 48 h or silenced for TRAP1 or exposed to the combination of cetuximab and 2DG, 3PO, or TRAP1 silencing. Spheroids were counted if they were ≥ 40 μm in size. (D) Insert: TRAP1 and PFK1 immunoblot analyses in patient‐derived spheroids silenced for TRAP1. (F) Plot representing the relationship between 18FFDG PET uptake at baseline and percent of size variation of target lesions according to RECIST criteria in mCRCs treated with first‐line chemotherapy combined with cetuximab. Graphs represent mean ± SD of three experiments. The Mann–Whitney test was used to establish the statistical significance between two groups (P < 0.05). B. ANOVA test: P = 0.002; Bonferroni post hoc test: CTRL pmock vs CTX pmock, lactate production: P < 0.001, PFK1 activity: P < 0.001; CTRL pTRAP1 vs CTX pTRAP1, lactate production: P > 0.05, PFK1 activity: P > 0.05; CTRL pmock vs CTRL pTRAP1, lactate production: P > 0.001, PFK1 activity: P < 0.001. D. ANOVA test: P = 0.01; Bonferroni post hoc test: CTRL vs CTX P > 0.05; CTRL 2‐DG vs CTX 2‐DG P < 0.001; CTRL 3PO vs CTX 3PO P < 0.001; siTRAP1 vs siTRAP1 CTX P < 0.001. E. ANOVA test: P < 0.007; Bonferroni post hoc test: CTRL vs CTX lactate production: P = 0.05, PFK1 activity: P < 0.001; CTRL 2‐DG vs CTX 2‐DG lactate production: P < 0.001, PFK1 activity P < 0.001; CTRL 3PO vs CTX 3PO lactate production: P < 0.001, PFK1 activity: P < 0.001; siTRAP1 vs siTRAP1 CTX lactate production: P < 0.01, PFK1 activity: P < 0.001.
