Fig. 2.

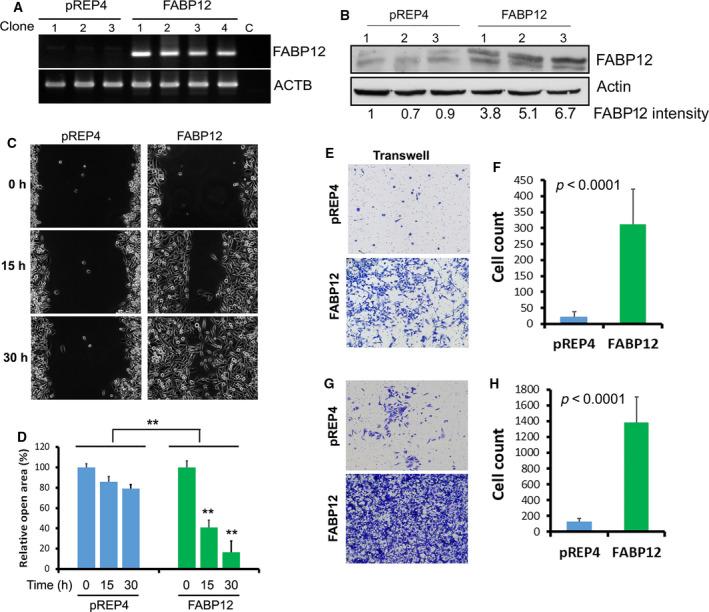
FABP12 promotes cell migration and invasion in prostate cancer cells. (A) Semiquantitative RT‐PCR analysis of FABP12 RNA levels in PC3 cells with stable ectopic expression of pREP4 empty vector (pREP4) or pREP4‐FABP12 expression construct (FABP12). β‐actin (ACTB) was used as the loading control for PCRs. (B) FABP12 protein levels were quantified relative to β‐actin in stably transfected PC3 cell lines. Lane 1 (set at 1) serves as the reference lane. (C) Cell motility of PC3 cells stably transfected with pREP4‐FABP12 constructs (FABP12, right panel) or control (pREP4, left panel), measured using the scratch assay. (D) Open areas relative to the initial scratched areas (which were set to 100%) at the designated time points were quantified and analyzed by two‐way ANOVA (N = 3). The open area of the scratch was 100%, 86%, and 79% at 0, 15, and 30 h, respectively, for the PC3‐pREP4 cells, compared to 100%, 41%, and 17% for the PC3‐FABP12 cells (P < 0.001). (E, F) Representative images (E) and results of Students t‐test analysis (F) showing differences in cell migration for PC3 cells stably transfected with pREP4 (control) or pREP4‐FABP12 (FABP12) constructs using the Transwell assay. (G, H) Representative images (G) and results of Student's t‐test analysis (H) showing differences in cell invasion for PC3 cells stably transfected with pREP4 (control) or pREP4‐FABP12 (FABP12) constructs using the Matrigel assay. N = 3 for each cell line tested for cell migration and invasion. Error bars: SD.
