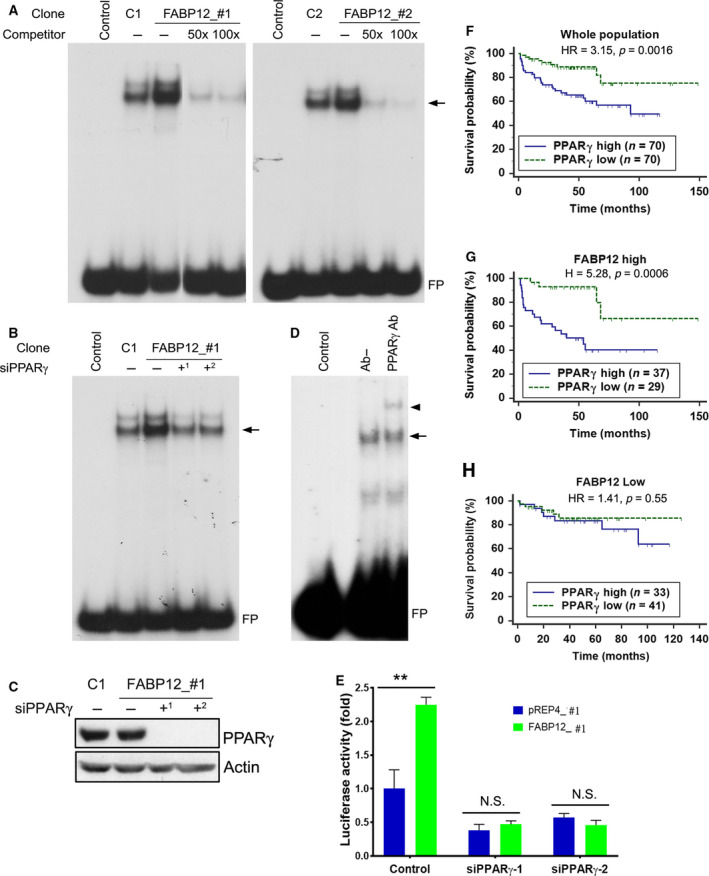
Fig. 5.

FABP12 facilitates activation of PPARγ and determines PPARγ prognostic significance. (A) Nuclear extracts prepared from two stable PC3‐pREP4‐FABP12 clonal populations (FABP12_#1, FABP12_#2; lanes 3) enhanced the formation of nuclear protein–PPRE complexes (arrow) compared to control PC3‐pREP4 clonal populations (C1, C2; lanes 2) in an electrophoretic mobility shift assay (EMSA). Excess unlabeled PPRE probe (50× excess in lanes 4 and 100× excess in lanes 5) effectively competed with the radiolabeled probe, resulting in considerably reduced protein–PPRE complexes. FP denotes free probe. (B) PPARγ depletion in stable PC3‐pREP4‐FABP12 transfectants using two different siRNAs reduced protein–PPRE complex formation (arrow) (compare lane 3 with lanes 4 and 5). (C) Western blot showing reduced levels of PPARγ in cells transfected with two PPARγ siRNAs, with actin serving as the loading control. (D) A supershifted protein–PPRE complex (arrowhead) is observed upon addition of anti‐PPARγ antibody (lane 3). No antibody was added to lane 2 (Ab−). (E) PPRE‐driven luciferase activity in PC3 control (pREP4) and PC3‐FABP12 overexpression (FABP12) stable cell lines transfected with scrambled (control) or PPARγ‐specific siRNAs. Statistical analysis was done using Student's t‐test. (F–H) High levels of PPARγ mRNA are significantly correlated with a worse prognosis in a PCa patient cohort (MSKCC dataset described in [48]) (F). This prognostic significance is markedly increased in the subpopulation of PCa patients with high levels of FABP12 mRNA (G), but eliminated in the subpopulation with low FABP12 levels (H). Log‐rank test was used for patient survival analysis. The cutoff point for stratifying PPARγ mRNA levels was determined by receiver operating characteristic (ROC) analysis using disease‐free status as a classification factor. HR, hazard ratio; n, sample size. Error bar: SD.
