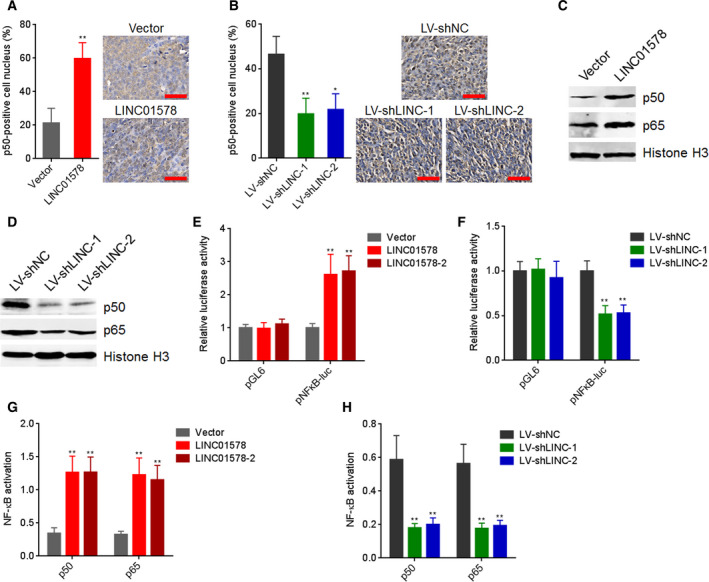
Fig. 6.

LINC01578 activates NF‐κB signaling. (A) p50 IHC staining of liver metastatic tumors derived from LINC01578‐overexpressed and control DLD‐1 cells. Scale bars, 50 µm. (B) p50 IHC staining of liver metastatic tumors derived from LINC01578‐depleted and control LoVo cells. Scale bars, 50 µm. (C) Nuclear p50 and p65 levels in LINC01578‐overexpressed and control DLD‐1 cells were detected by western blot. (D) Nuclear p50 and p65 levels in LINC01578‐depleted and control LoVo cells were detected by western blot. (E) Firefly luciferase reporters containing NF‐κB binding sites (pNFκB‐luc) were transfected into LINC01578‐overexpressed and control DLD‐1 cells. Then, luciferase reporter assays were performed to determine NF‐κB transcriptional activity. (F) Firefly luciferase reporters containing NF‐κB binding sites (pNFκB‐luc) were transfected into LINC01578‐depleted and control LoVo cells. Then, luciferase reporter assays were performed to determine NF‐κB transcriptional activity. (G) p50 and p65 activation in nuclear extracts from LINC01578‐overexpressed and control DLD‐1 cells was determined by NF‐κB p50 Transcription Factor Assay Kit and NF‐κB p65 Transcription Factor Assay Kit, respectively. (H) p50 and p65 activation in nuclear extracts from LINC01578‐depleted and control LoVo cells was determined by NF‐κB p50 Transcription Factor Assay Kit and NF‐κB p65 Transcription Factor Assay Kit, respectively. Data are shown as mean ± SD based on n = 6 mice in each group (A,B) or three independent experiments (C–H). *P < 0.05, **P < 0.01 by the Mann–Whitney test (A), Kruskal–Wallis test followed by Dunn's multiple comparisons test (B), or one‐way ANOVA followed by Dunnett's multiple comparisons test (E–H).
