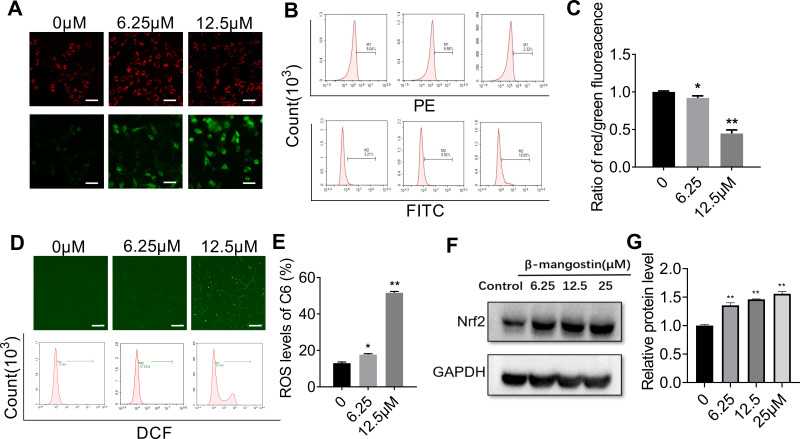
Figure 2.
Effect of β-mangostin on oxidative stress in glioma cells. C6 cells are treated with two concentrations of β-mangostin (6.25 and 12.5 μM). (A-C) The mitochondrial membrane potential in C6 cells is detected using fluorescence microscopy and flow cytometry (Scar bar:500 μm). (D-E) The active oxygen levels in C6 cells is detected using fluorescence microscopy and flow cytometry (Scar bar:2 mm). (F-G) The oxidative stress relevant protein (Nrf2) levels in C6 is detected using Western blotting. Data are the mean±SD for three independent experiments. **P<0.01 and *P<0.05 vs. controls.

