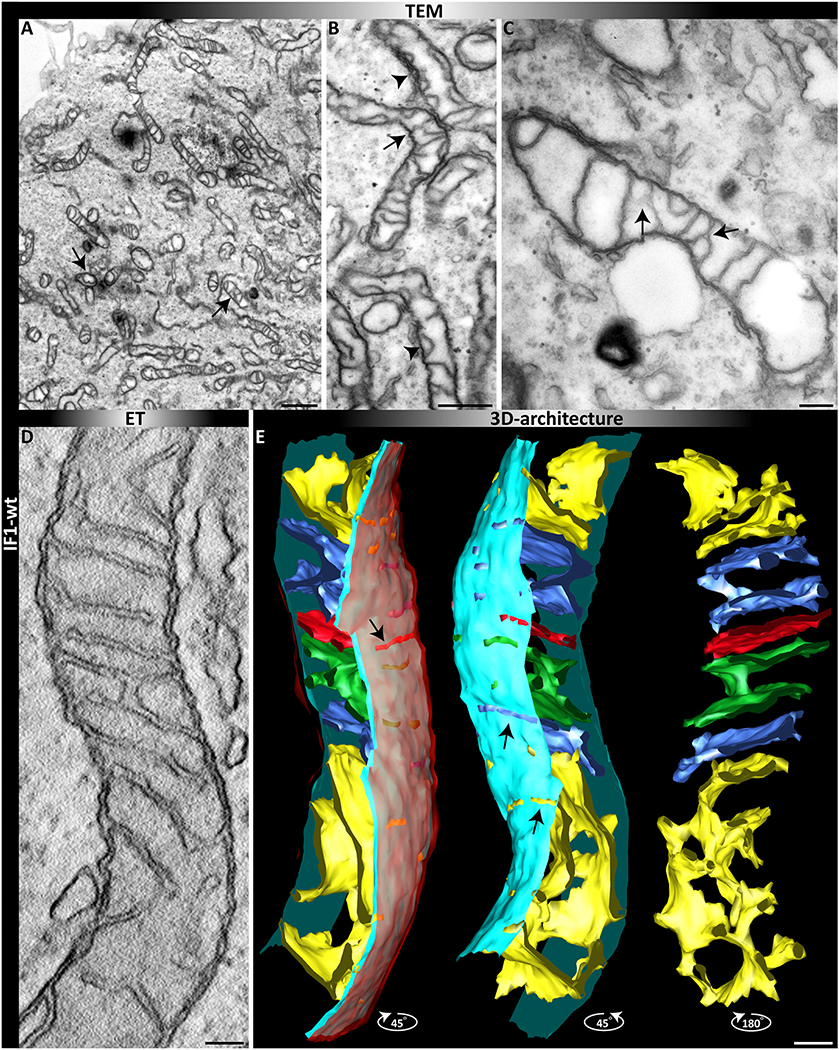
Fig. 6.
2D and 3D view of mitochondria in cells expressing IF1. (A–C) TEM after fixation of monolayers of cells. (A) Overview. (B) Magnified view, arrows indicate altered cristae structures such as arches and branches. (D-E) ET of a single mitochondrion with altered ultrastructure in the presence of IF1. (D) Single tomographic slice. (E) 3D reconstruction after segmentation; different view angles are shown. From left to right: Full segmentation. The outer membrane (OM) is depicted in translucent red, the light blue indicates the inner boundary membrane and cristae are in different colors. Mid: view from a different angle without the OM. Right: only cristae are shown. Scale bars: 1 μM (A); 500 nm (B), 200 nm (C); 100 nm (D, E).

