
Figure 1:
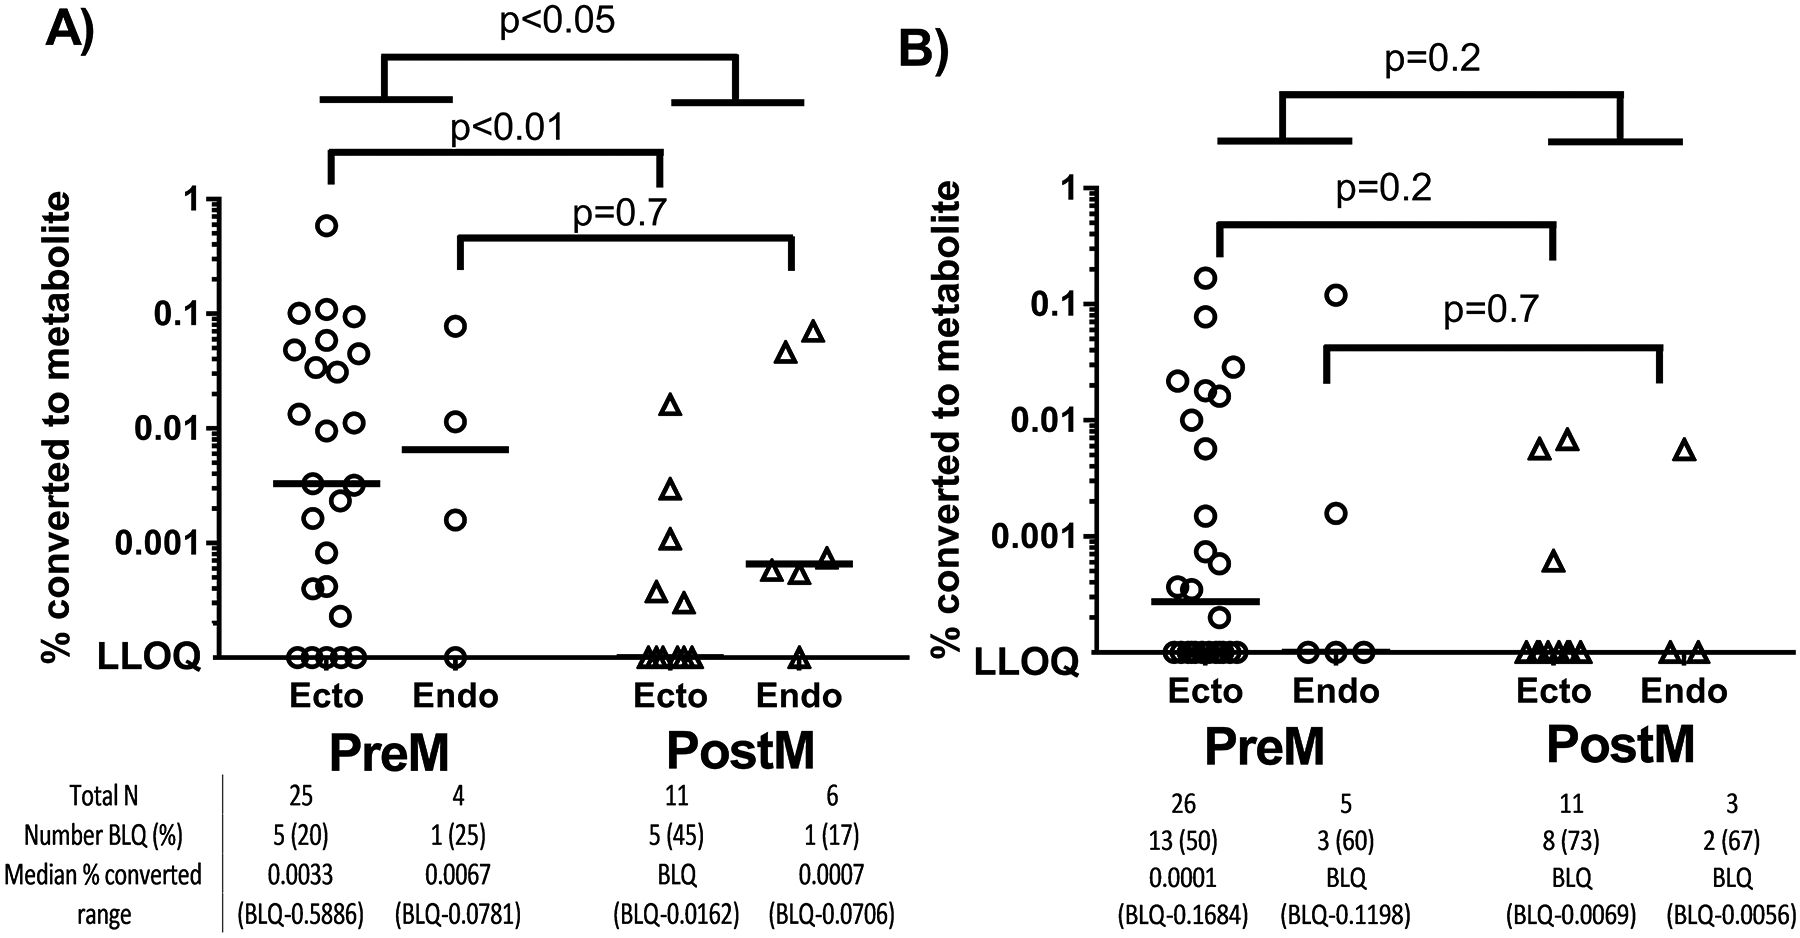
Reduced nucleotide metabolite concentrations in postM explants. The measured TFVdp (A) or FTCtp (B) following a 24 hour incubation in TFV or FTC 10–300 μg/mL is shown as a percentage of the parent incubation concentration. Circles (preM) and triangles (postm) represent individual explant concentrations and the lines represent median vales. The uppermost p-values represent comparisons between preM and postM when ectocervix and endocervix were pooled together while the middle and lower p-values comparison between ectocervix and endocervix respectively.