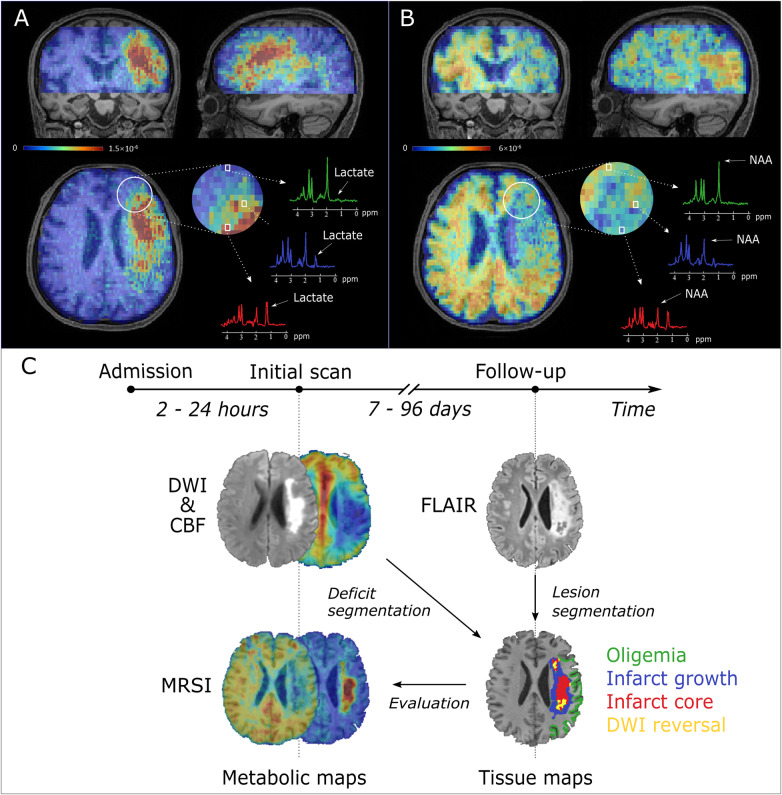
Figure 1.
3D MRSI for an acute ischaemic stroke patient brain at a nominal spatial resolution of 2.0 × 3.0 × 3.0 mm3 in an 8-min scan. (A) 3D lactate map in triplanar views overlaid on T1-weighted images. The representative spectra were acquired from the infarct core (red), infarct growth (blue) and oligemia (light green) regions, respectively. (B) 3D NAA map in triplanar views overlaid on T1-weighted images. The representative spectra were acquired from the infarct core (red), infarct growth (blue) and oligemia (light green) regions, respectively. (C) Timeline of the experimental study.

