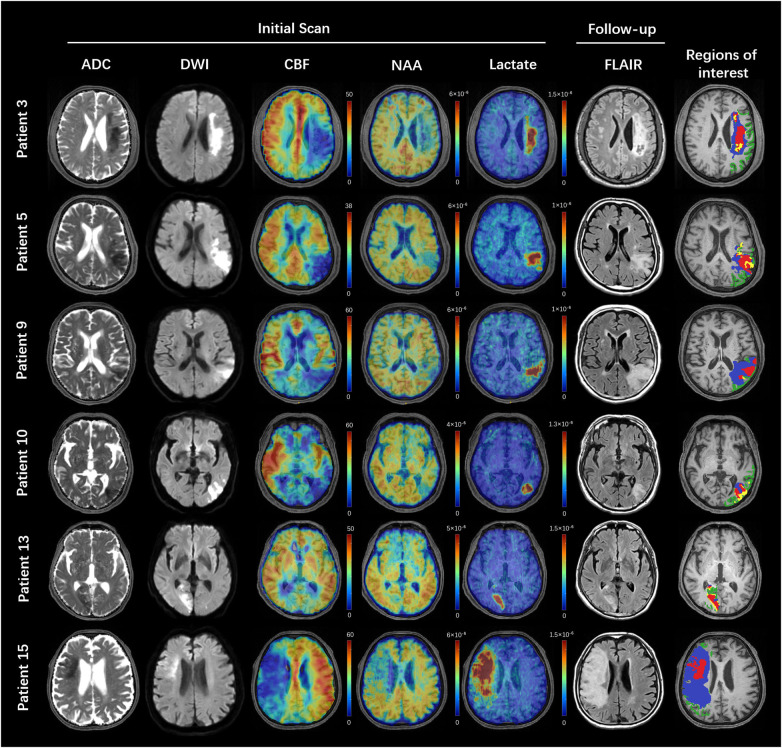
Figure 2.
Multimodal images from representative patients. All the images were registered to the structural T1-weighted images. The ADC, DWI, cerebral blood flow and MRSI images were acquired in the first scan. The FLAIR images were acquired in the follow-up session. The colour bar for ASL-PWI shows the cerebral blood flow in ml/100 g/min. The colour bar for MRSI shows NAA or lactate level in institutional units. Regions of interest: light green = oligemia; blue = infarct growth; yellow = DWI reversal; red = infarct core.

