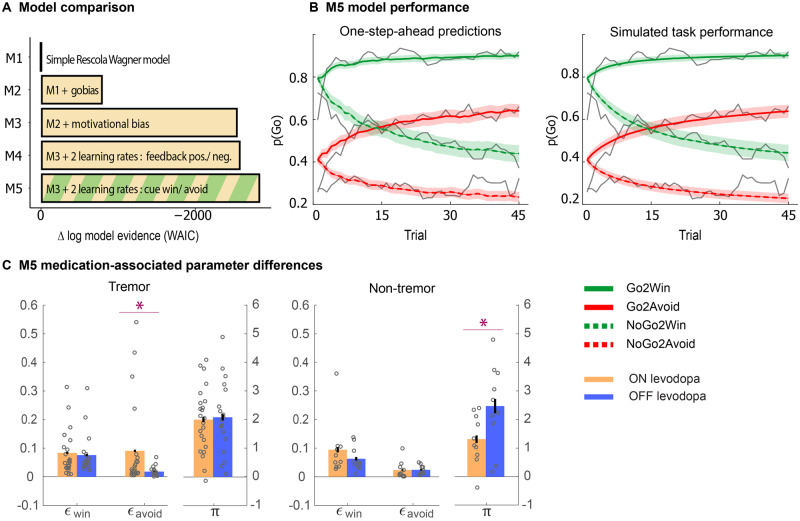
Figure 3.
Model and parameter inference. (A) Estimated negative log model evidence (WAIC), relative to model M1. Lower (i.e. more negative) WAIC indicates better model evidence. The simplest model M1 contains a feedback sensitivity (ρ) and learning rate (ε) parameter. Model evidence improves with addition of a Go-bias (b) (M2), motivational bias (π) (M3), and a separation of learning rates either by the sign of the prediction error (positive prediction error: ε+pe; negative prediction error: ε−pe; M4), or cue valence (Win: εwin; Avoid: εavoid; M5). M5 performs best. (B) One-step-ahead predictions and posterior predictive model simulations of winning base model M5. This shows how the winning model captures the behavioural data (grey lines). Both methods use the fitted model parameters to compute the choice probabilities. The one-step-ahead predictions compute probabilities based on the history of each participant’s actual choices and outcomes, whereas the simulation method generates new choices and outcomes based on the response probabilities. (C) Effect of levodopa on parameter estimates generated from M5: (Difference ON − OFF levodopa in each Parkinson motor phenotype); we found that the tremor-dominant group showed a significant increase in punishment learning, while the non-tremor groups shows a significant decrease in motivational bias. Error bars represent standard error of the differences. *P < 0.05.

