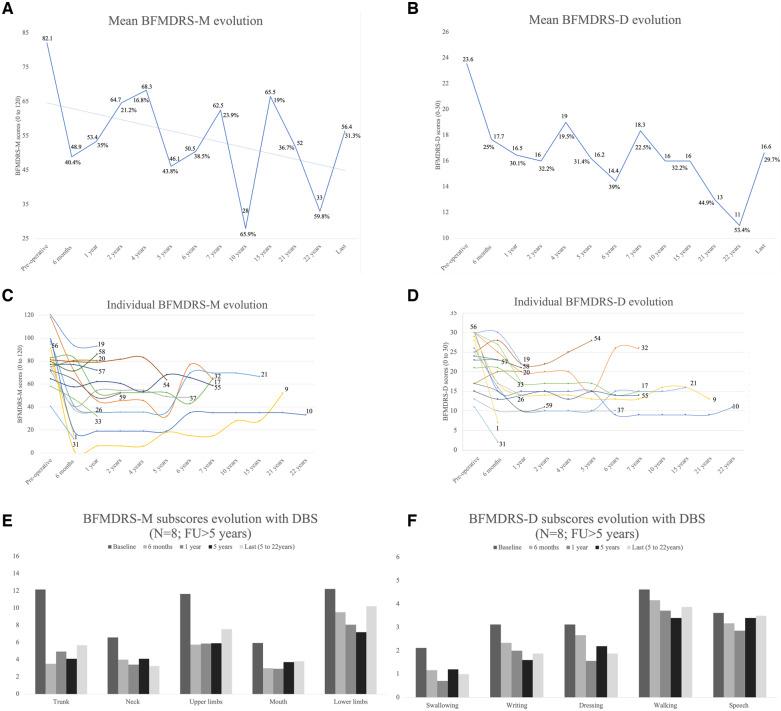
Figure 3.
Evolution of BFMDRS for the DBS cohort (n = 18) and evolution of dystonia and motor function with DBS for patients followed >5 years with DBS (n = 8). (A) Mean score of BFMDRS-M (range: 0–120). (B) Mean score of BFMDRS-D (range: 0–30). (C) Spaghetti plots displaying individual dystonia evolution with DBS, as assessed by the BFMDRS-M. (D) Spaghetti plots displaying individual dystonia evolution with DBS, as assessed by the BFMDRS-D. (E) Evolution of motor function as assessed by the motor section of the BFMDRS followed for >5 years with DBS. (F) Evolution of motor function as assessed by the disability section of the BFMDRS followed for >5 years with DBS.

