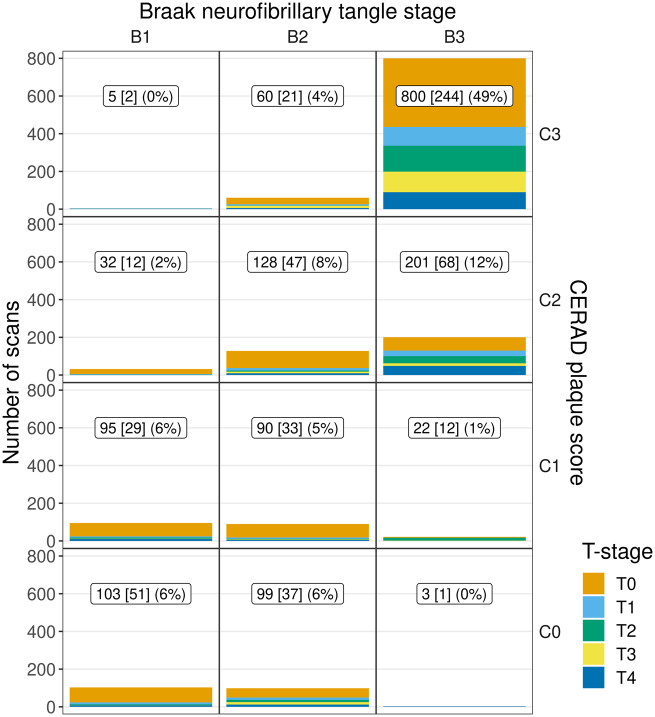
Figure 2.
Data distribution by TDP-43 stage within combinations of Braak stage and CERAD score. The label in each panel indicates number of scans [number of subjects] (per cent of all scans) for each combination of Braak NFT stage and CERAD score (across all TDP-43 stages) present in the data. This distribution prompted us to form three ADNC strata: high-ADNC, low-ADNC, and PART.

