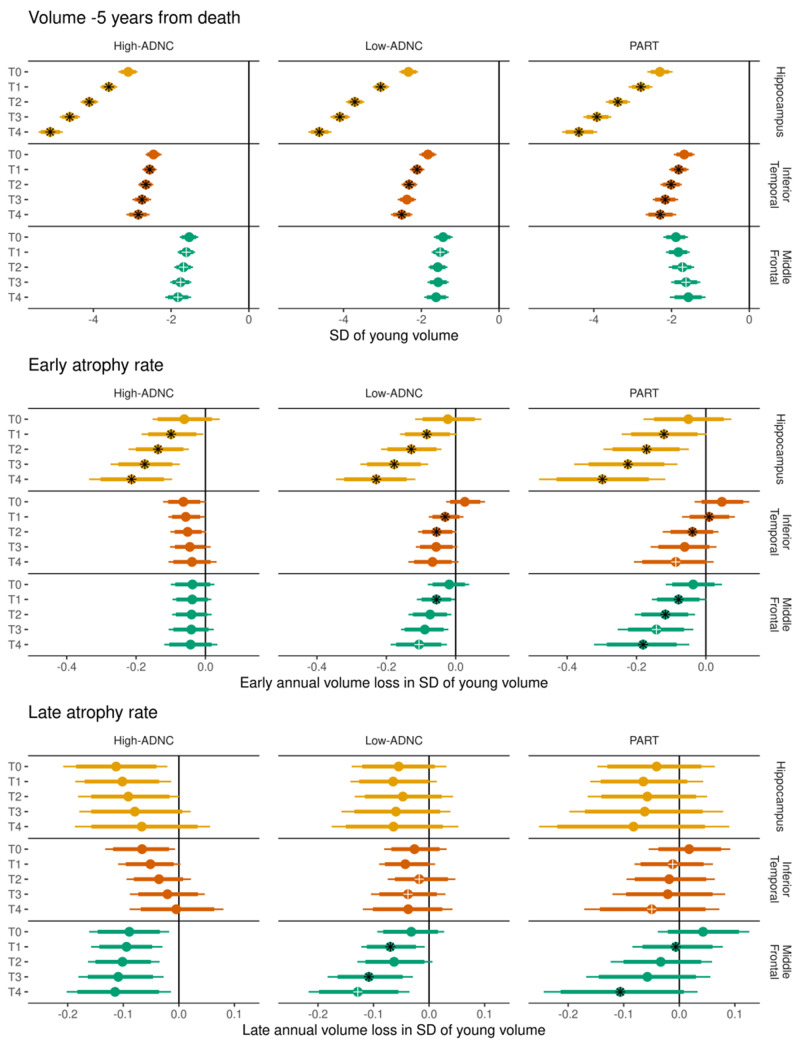
Figure 4.
The three main components of the model in each ADNC group by TDP-43 stage, across regions. Top: The estimated volume in z-score units across TDP-43 stages (T-stages); Middle: the early atrophy rates in z-score units per year; and Bottom: the late atrophy rates in z-score units per year (defined as the early atrophy rate term plus the acceleration/modification term from the model). In each row, the median posterior estimate is represented by a circle, with the thick and thin bars representing 80% and 90% intervals of the posterior distribution. Comparisons between adjacent T-stages within a region and ADNC group are represented as follows: a black asterisk overlaid on the median estimate indicates strong evidence (probability > 95%) of a difference between that estimate and the immediately preceding TDP-43 stage, while a white cross indicates moderate evidence (probability > 90%) of a difference. For example, in the middle panel and focusing on PART (third column), early atrophy in the inferior temporal (second row), the black asterisk in T1 indicates strong evidence the early atrophy rate in T1 was faster than in T0. The white cross in T4 indicates moderate evidence the atrophy rate in T4 was faster than in T3. Because no symbol is seen on the T3 estimate, we say there was little evidence that T3 early atrophy was faster than T2 early atrophy. SD = standard deviation.

