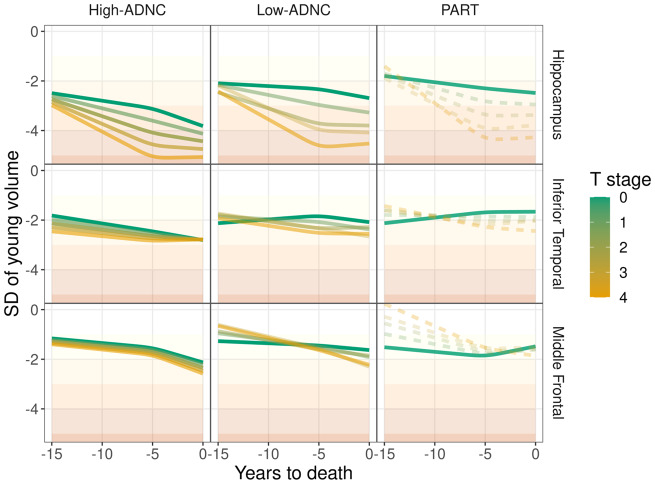
Figure 5.
Estimated mean volume by ADNC group (columns) and region (rows), demonstrating how volume shift, early atrophy rate, and late atrophy rate are combined over the last 15 years of life. Volumes across TDP-43 stage (T-stage) are represented by colour gradient ranging from low TDP-43 stage (green) to high TDP-43 stage (orange). Dashed lines indicate a grouping of ADNC group and TDP-43 stage with <2% representation in our cohort, by scan count. Higher transparency also indicates groups with less representation in our cohort, with 10% or greater representation being opaque. SD = standard deviation.

