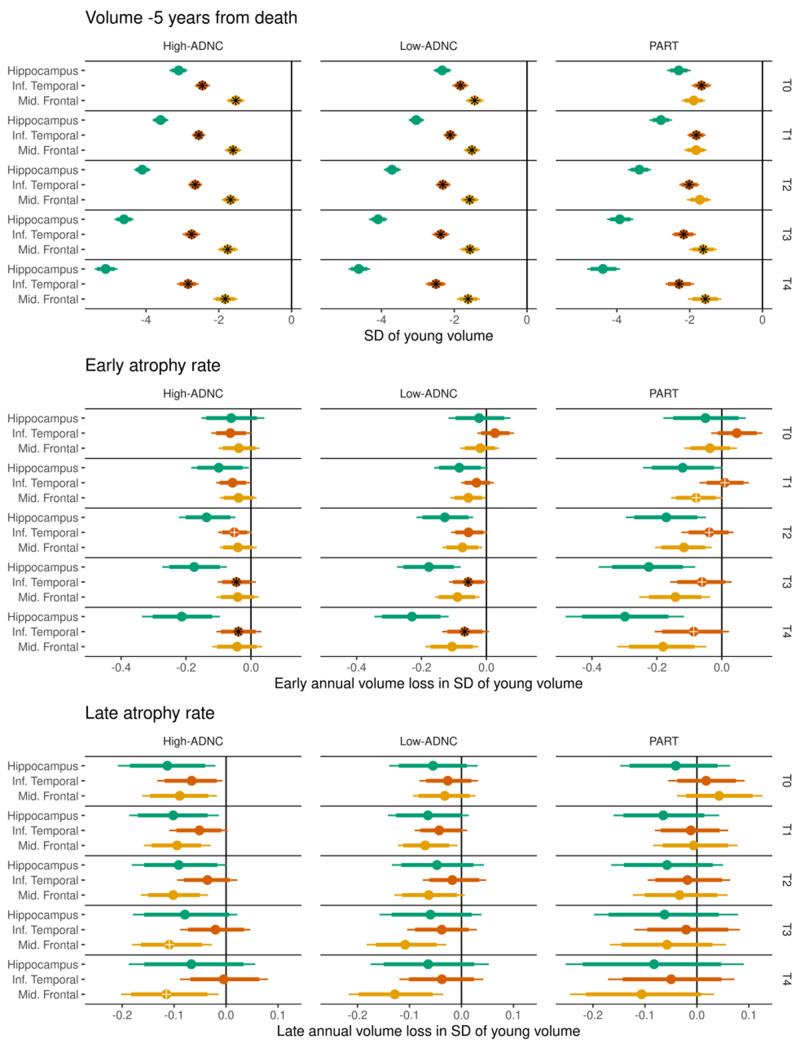
Figure 6.
Regions are placed next to each other to allow for better visualization and interpretation of differences in volumes, early atrophy rate and acceleration between the three regions. As in Fig. 4, a black asterisk overlaid on the point estimate indicates strong evidence (probability > 95%) of a difference between that estimate and the immediately preceding TDP-43 stage (T-stage), while a white cross indicates moderate evidence (probability > 90%) of a difference, similar to Fig. 4.

