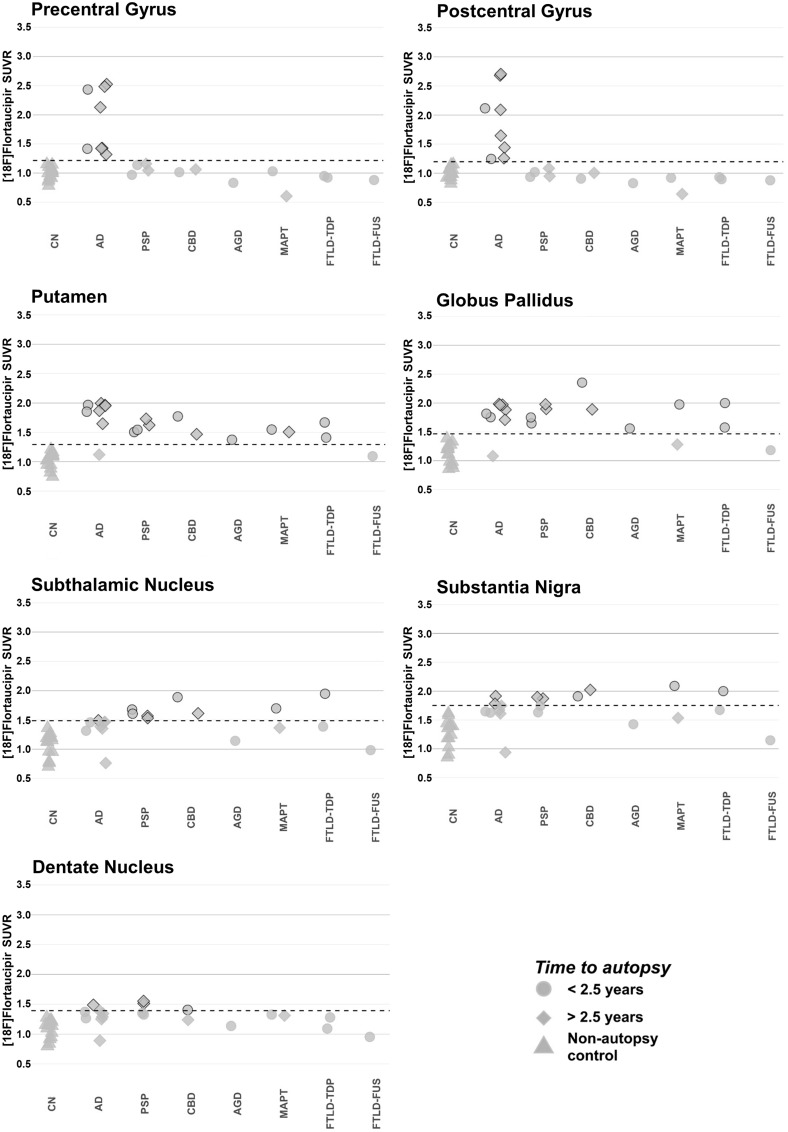
Figure 6.
FTP-PET SUVR quantification at precentral gryus, postcentral gyrus, and subcortical regions of interest. SUVR quantification, not corrected for partial volume effects, was performed at precentral gyrus, postcentral gyrus, putamen, globus pallidus, subthalamic nucleus, substantia nigra, and dentate nucleus regions of interest. Each patient is represented by a single point and coded by time from PET-to-autopsy (shape) and primary neuropathological diagnosis (x-axis). The dotted line represents the threshold for significance, which is calculated from the mean SUVR plus two standard deviations for the young, cognitively normal (CN), non-autopsy controls. Points crossing the significance threshold are highlighted with a black outline. AD = Alzheimer’s disease; AGD = argyrophilic grain disease.

