Figure 3.
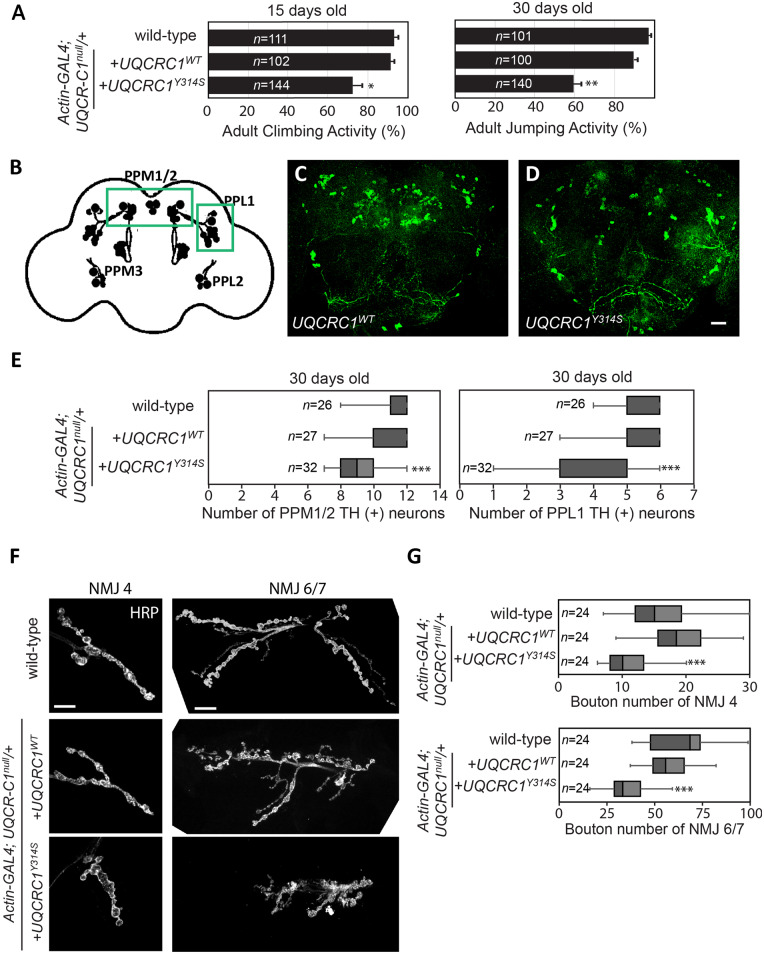
UQCRC1 p.Tyr314Ser expression in Drosophila causes age-dependent locomotor defects, loss of TH-positive neurons and presynaptic defects in NMJs. (A) Climbing and jumping assays for wild-type control and flies that expressed either the wild-type UQCRC1 (UQCRC1WT) or mutant UQCRC1 p.Tyr314Ser (UQCRC1YS314S). The number of tested flies was shown in the bar graph and assays were repeated three times for each genotype. For the climbing assay, wild-type versus UQCRC1WT was 95.38 ± 6.21% versus 93.24 ± 5.13%, F(1, 81) = 4.8, P = 0.43; UQCRC1WT versus UQCRC1YS314S was 93.24 ± 5.13% versus 72.35 ± 7.38%, F(1,84) = 5.7, P = 0.021. For the jumping assay, wild-type versus UQCRC1WT was 98.25 ± 3.51% versus 90.13 ± 4.88%, F(1,81) = 6.7, P = 0.10; UQCRC1WT versus UQCRCY314S was 90.13 ± 4.88% versus 60.79 ± 6.42%, F(1,98) = 45.2, P = 0.006; all were based on one-way ANOVA. **P < 0.01. (B–D) Whole-mount adult brains were immunostained with anti-TH (green) to label individual dopaminergic neuronal clusters in 30-day-old flies. Images are representative of (B) schematic representation of the distribution of dopaminergic neurons in the Drosophila adult brain. Dopaminergic neurons are grouped in small clusters arranged with bilateral symmetry. PPL = protocerebral posterior lateral; PPM = protocerebral posterior medial. (C) UQCRC1WT files, and (D) UQCRC1Y314S flies. Scale bar = 20 µm. (E) Quantification of neurons that stained anti-TH-positive in the PPM1/2 and PPL1 clusters in individual genotypes at 30 days old [for PPM1/2, wild-type versus UQCRC1WT was 11.75 ± 0.38 versus 10.58 ± 0.23, F(1,45) = 6.8, P = 0.23; UQCRC1WT versus UQCRC Y314S was 10.58 ± 0.23 versus 8.12 ± 0.19, F(1,57) = 27.8, P = 0.007; For PPL1, wild-type versus UQCRC1WT was 5.57 ± 0.11 versus 5.61 ± 0.14, F(1,45) = 5.3, P = 0.49; UQCRC1WT versus UQCRC1 Y314S was 5.61 ± 0.14 versus 4.08 ± 0.22, F(1,57) = 20.3, P = 0.009 by one-way ANOVA]. (F) Representative confocal microscopy images show NMJs in third-instar larvae. Left: NMJ segment 4 (NMJ4) and right: NMJ segment 6/7 (NMJ6/7) are labelled with the membrane marker HRP. Fly genotypes are: (top row) wild-type control, (middle row) wild-type human UQCRC1 (UQCRC1WT), and (bottom row) human UQCRC1 p.Tyr314Ser mutant (UQCRC1Y314S). Scale bars = 20 µm. (G) NMJ sizes were quantified as the bouton number divided by the muscle area of NMJ4 or NMJ 6/7, expressed as bouton number × 104/muscle area (µm2). Average NMJ sizes (mean ± SEM) were compared with the one-way ANOVA post hoc Tukey test; ***P < 0.001. Sample numbers (n) are shown inside the box-and-whiskers plots.

