Figure 4.
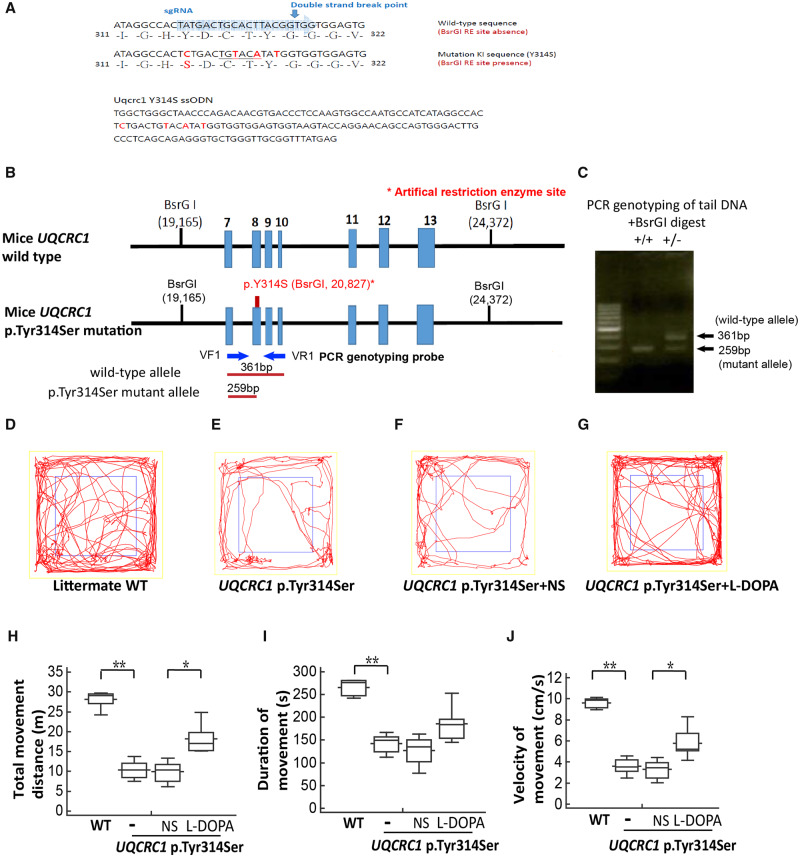
Genotype analysis and locomotor behaviour assay of UQCRC1 p.Y314 knock-in mice. (A) Single-stranded oligodeoxynucleotide for targeting mice UQCRC1 and Sanger sequencing of UQCRC1 p.Tyr314Ser sequence in knock-in mice. Top: The wild-type target mouse UQCRC1 gene sequence (blue); Bottom: The p.Tyr314Ser substitution sequence of the single-stranded oligodeoxynucleotide (ssODN) used for targeted mutagenesis in mice. Silent mutations were included to generate BsrGI restriction enzyme recognition sequences. (B) Gene targeting strategy. Top: Region of the mouse wild-type UQCRC1 gene that encompasses exons 7–13. Middle: Exons 7–13 are shown with the c.941A>C mutation (p.Tyr314Ser). The 5′ and 3′ diagnostic probes (blue arrows) were used in the PCR genotyping analysis. The artificial restriction enzyme sites recognized by the BsrGI enzyme are shown (black ticks) with their locations (bp) in the gene. Bottom: BsrGI restriction fragments predicted to be unique to the wild-type (361bp) and targeted (259 bp) alleles. (C) PCR genotyping of tail-blood DNA from mice of two genotypes, a mutant homozygote (+/+, left) and heterozygote (+/−; right), with a molecular weight marker. DNA samples were digested with BsrGI enzyme and PCR was performed with the following primers: VF1: 5′-CCACGTGGCCATTGCAGTAGA-3′ and VR1: 5′- TCGATACTCATGGCATCACAGAC-3′. (D–G) Trace plots of the open field locomotor tests of age and gender-matched littermate wild-type (WT) control (D), UQCRC1 p.Tyr314Ser knock-in mice (E), and UQCRC1 p.Tyr314Ser knock-in mice receiving normal saline (NS) (F) and l-DOPA treatment (G) at the age of 12 months. (H–J) Parameters of wild-type and UQCRC1 p.Tyr314Ser knock-in mouse locomotor activities with and without normal saline or l-DOPA treatment. (H) Total distance travelled of UQCRC1 p.Tyr314Ser knock-in mice versus control mice was 10.9 ± 0.8 m versus 28.9 ± 2.4 m; F(1,11) = 72.3, P < 0.01 by one-way ANOVA. The total movement distance of UQCRC1 p.Tyr314Ser knock-in mouse after intraperitoneal injection of l-DOPA compared to vehicle (saline) was 18.3 ± 0.9 m versus 9.9 ± 0.8 m, F(1,10) = 6.4, P = 0.03 by one-way ANOVA. (I) Total movement time of UQCRC1 p.Tyr314Ser knock-in mice versus control mice; 142.3 ± 11.8 s versus 265.2 ± 28.7 s; F(1,11) = 21.3, P < 0.01 by one-way ANOVA. The total movement duration of UQCRC1 p.Tyr314Ser knock-in mouse after intraperitoneal injection of l-DOPA compared to vehicle (saline) was 175.9 ± 38.5 s versus 127.2 ± 33.0 s, F(1,10) = 2.1, P = 0.07 by one-way ANOVA. (J) Movement velocity of UQCRC1 p.Tyr314Ser knock-in mice versus control mice was 3.6 ± 0.3 cm/s versus 9.6 ± 0.8 cm/s; F(1,11) = 59.1, P < 0.01 by one-way ANOVA. Movement velocity of UQCRC1 p.Tyr314Ser knock-in mouse after intraperitoneal injection of l-DOPA compared to vehicle (saline) was 5.6 ± 1.7 cm/s versus 3.3 ± 0.9 cm/s, F(1,10) = 8.7, P = 0.01 by one-way ANOVA. n = 6 for each group; *P < 0.05; ** P < 0.01.

