Figure 5.
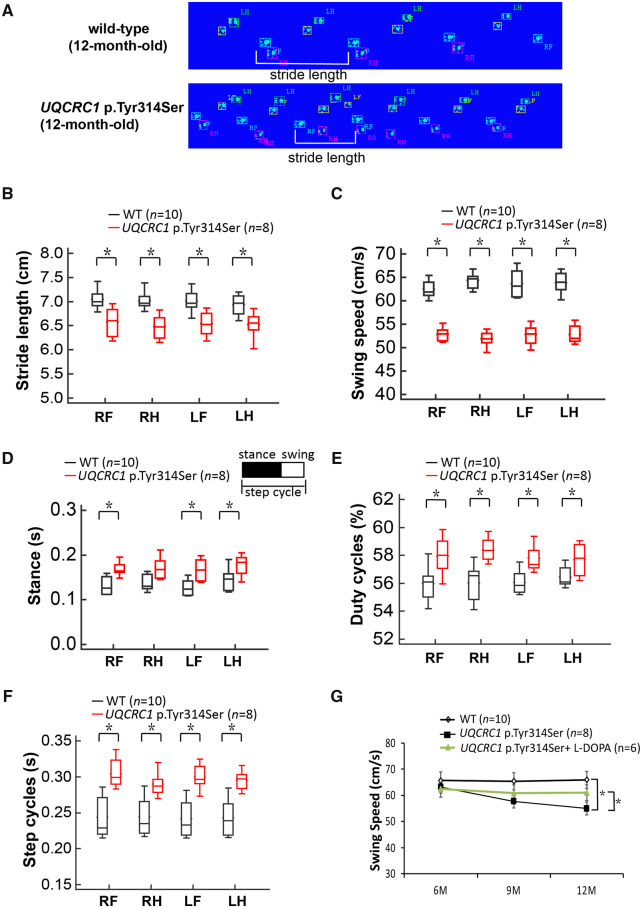
Gait analysis of UQCRC1 p.Tyr314Ser knock-in mice. (A) Representative illuminated footprints recorded from (top) wild-type littermate controls and (bottom) UQCRC1 p.Tyr314Ser knock-in mice at the age of 12 months as they walked across the CatWalk platform. One stride length (white bracket) is illustrated in each track. (B–F) Different parameters of the CatWalk analyses of wild-type (black box-and-whiskers) and UQCRC1 p.Tyr314Ser knock-in (red box-and-whiskers) mice show that (B) stride length and (C) swing speed was significantly decreased, but (D) stances, (E) duty cycles, and (F) paw step cycles increased significantly in UQCRC1 p.Tyr314Ser knock-in mice compared to the littermate wild-type controls. (G) Serial analysis of swing speeds in littermate wild-type controls and UQCRC1 p.Tyr314Ser knock-in mice with, and without, l-DOPA treatment from 6 to 12 months of age. Wild-type littermate controls versus UQCRC1 p.Tyr314Ser knock-in mice were 62.8 ± 4.1 cm/s versus 61.4 ± 3.4 cm/s at 6 months, F(1,16) = 2.1, P = 0.76; 62.5 ± 5.1 cm/s versus 56.9 ± 3.7 cm/s at 9 months, F(1,16) = 6.2, P = 0.03; 63.2 ± 3.2 cm/s versus 52.4 ± 2.3 cm/s at 12 months; F(1,16) = 34.8, P = 0.01 by one-way ANOVA. UQCRC1 p.Tyr314Ser knock-in mice with (green line) versus without l-DOPA treatment was 60.9 ± 4.6 cm/s versus 61.4 ± 3.4 cm/s at 6 months, F(1,14) = 2.4, P = 0.89; 59.2 ± 4.3 cm/s versus 56.9 ± 3.7 cm/s at 9 months, F(1,14) = 5.3, P = 0.07; 60.1 ± 4.1 cm/s versus 52.4 ± 2.3 cm/s at 12 months; F(1,14) = 9.8, P = 0.04 by one-way ANOVA. n = 6–10 for each genotype in each experiment. LF = left front paw; LH = left hind paw; RF = right front paw; RH = right hind paw; *P < 0.05; **P < 0.01.

