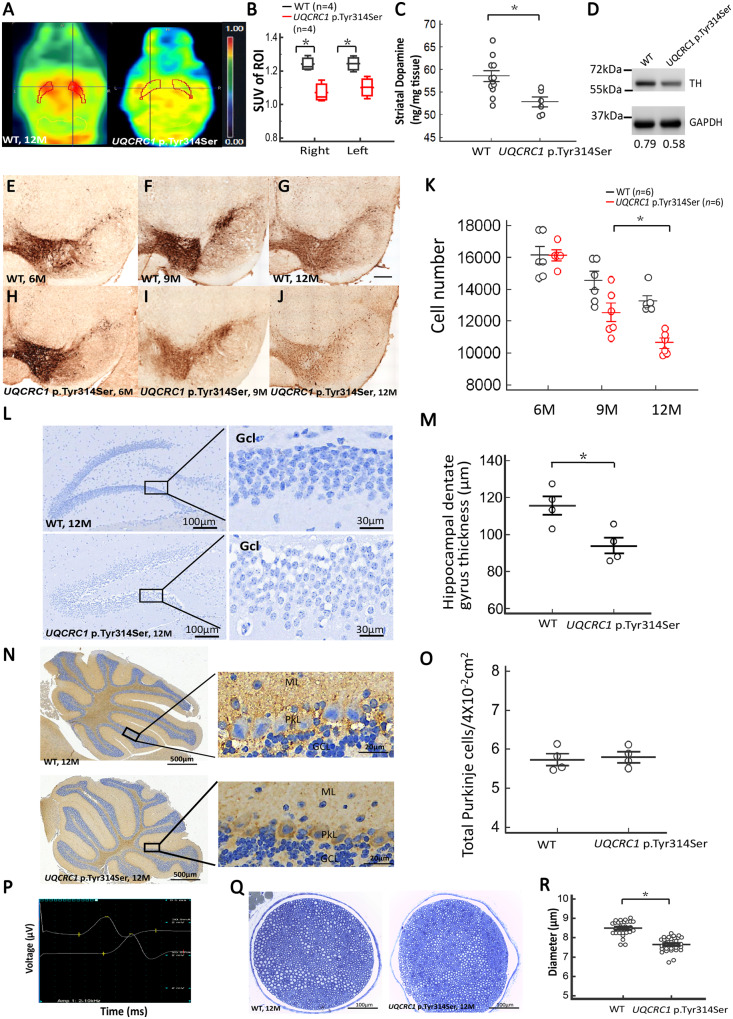
Figure 6.
Striatal dopamine, substantia nigra TH-positive cells, hippocampal dentate gyrus neurons, cerebellar Purkinje cells immunostaining and sciatic nerve fibre changes of wild-type and UQCRC1 p.Tyr314Ser knock-in mice. (A) Axial series of 6-18F-fluoro-l-DOPA PET images in 12-month-old (left) wild-type littermates (WT) and (right) UQCRC1 p.Tyr314Ser knock-in mice. The bilateral striatum was drawn manually to indicate the region of interest on the PET images. (B) The standard uptake values (SUVs) in the right and left regions of interest (shown in the PET images) were calculated and compared between wild-type littermates (black box-and-whiskers) and UQCRC1 p.Tyr314Ser knock-in (red box-and-whiskers) mice. The average SUV of right region of interest in wild-type littermates and UQCRC1 p.Tyr314Ser was 1.23 ± 0.06 and 1.06 ± 0.04, F(1,6) = 7.2, P = 0.02 by one-way ANOVA; the average SUV of the left region of interest in wild-type littermates and UQCRC1 p.Tyr314Ser was 1.27 ± 0.05 and 1.09 ± 0.03, F(1,6) = 6.9, P = 0.03 by one-way ANOVA. n = 4 for each genotype. (C) Scatterplot comparison of striatal dopamine concentration measured by HPLC in wild-type littermates and UQCRC1 p.Tyr314Ser knock-in mice at the age of 12 months. UQCRC1 p.Tyr314Ser knock-in mice versus control mice; 52.9 ± 2.6 µg/ml versus 58.5 ± 4.0 µg/ml; F(1,6) = 9.7, P = 0.013 by one-way ANOVA. (D) Schematic representations of western blot. At 12 months of age, UQCRC1 p.Tyr314Ser mice presented with lower nigral and striatal TH levels than littermate controls. The relative expression level of TH to the GAPDH in wild-type littermates versus UQCRC1 p.Tyr314Ser at the age of 12 months was 0.79 ± 0.04 versus 0.58 ± 0.07, F(1,4) = 10.2, P = 0.02 by one-way ANOVA. The experiments were repeated three times. *P < 0.05. (E–J) Representative mid-brain sections show anti-TH immunostaining of dopaminergic neurons in the SNc of (E–G) wild-type and (H–J) UQCRC1 p.Tyr314Ser knock-in mice at 6, 9, and 12 months of age, as indicated. ×100 magnification. (K) Average numbers of TH-positive neurons observed in the SNc of wild-type and UQCRC1 p.Tyr314Ser knock-in mice at 6, 9, and 12 months of age, determined with stereological counting. At 6 months, wild-type littermates versus UQCRC1 p.Tyr314Ser was 16 189 ± 621 versus 16 200 ± 735; P = 0.82; At 9 months, wild-type littermates versus UQCRC1 p.Tyr314Ser was 14 980 ± 683 versus 12 389 ± 702; P = 0.08; At 12 months, wild-type littermates versus UQCRC1 p.Tyr314Ser was 13 127 ± 591 versus 10 830 ± 782; P = 0.032 by one-way ANOVA. n = 6 mice in each genotype, for all analyses. Values are mean ± SEM. *P < 0.05. (L) Representative sections showed hippocampal dentate gyrus from wild-type (WT) and UQCRC1 p.Tyr314Ser knock-in mice at the age of 12 months using Nissl staining. Gcl = granule cell layer. (M) Quantitative evaluation of the hippocampal dentate gyrus thickness in wild-type and UQCRC1 p.Tyr314Ser knock-in mice at 12 months of age is shown. Wild-type littermates versus UQCRC1 p.Tyr314Ser was 115.57 ± 3.81 µm versus 86.30 ± 2.13 µm; F(1,7) = 0.65, P = 0.02 by one-way ANOVA. n = 4 mice in each genotype, for all analyses. Values are mean ± SEM. (N) Representative sections show posterior lobes of cerebellum from wild-type and UQCRC1 p.Tyr314Ser knock-in mice at the age of 12 months immunolabelled for the GABAergic enzyme, glutamate decarboxylase 67 (GAD67). GCL = granule cell layer; ML = molecular layer; PL = Purkinje cell layer. (O) The quantification of the mean number of GAD67-positive Purkinje cells in an area of 4 × 102 mm2 for wild-type littermate controls and UQCRC1 p.Tyr314Ser knock-in mice at 12 months of age is shown. Wild-type littermates versus UQCRC1 p.Tyr314Ser was 5.74 ± 0.31 versus 5.81 ± 0.26; F(1,7) = 0.11, P = 0.75 by one-way ANOVA. n = 4 mice in each genotype, for all analyses. Values are mean ± SEM. (P) Characteristic nerve conduction recordings of normal (top), distal, and (bottom) proximal motor responses. Sensitivity (y-axis): 2 µV/division; sweep speed (x-axis): 0.25 ms/division. (Q) Representative brightfield images of semithin sections of sciatic nerves derived from wild-type littermate controls and UQCRC1 p.Tyr314Ser knock-in mice at 12 months of age. Myelinated fibres were stained with toluidine blue. (R) Quantification of diameter of myelinated nerve fibres in sciatic nerve. Wild-type littermates versus UQCRC1 p.Tyr314Ser was 8.49 ± 0.23 µm versus 7.58 ± 0.31 µm; F(1,59) = 80.17, P = 0.01 by one-way ANOVA. n = 3 mice in each genotype. Data are presented as mean ± SEM. *P < 0.05, **P < 0.01.

