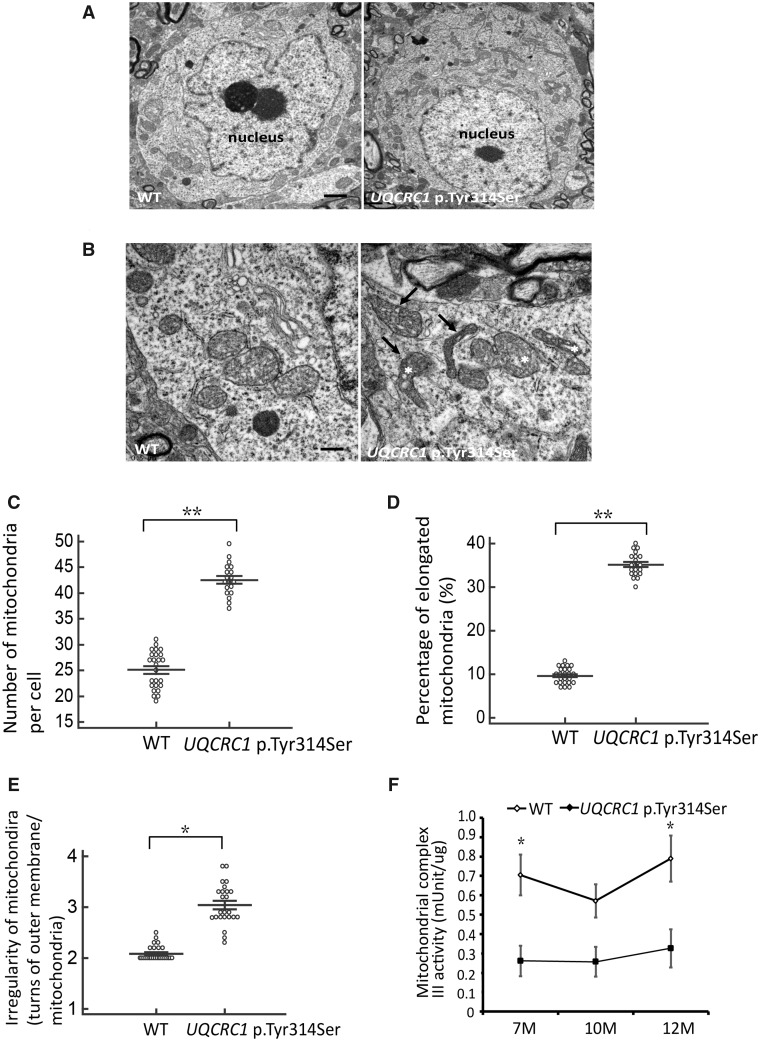
Figure 7.
Altered mitochondrial ultra-structures and reduced complex III activity in nigral neurons. (A) Representative images of cell bodies of nigral neurons from (left) wild-type and (right) UQCRC1 p.Tyr314Ser knock-in mice at 9 months of age. Scale bar = 2 µm. (B) Close examination reveals that many mitochondria in (right) UQCRC1 p.Tyr314Ser neurons are irregularly shaped (arrows) and appear fragmented (asterisks) compared to (left) wild-type neurons. Scale bar = 0.5 µm. (C) The mean number of mitochondria counted per cell body. Wild-type versus UQCRC1 p.Tyr314Ser; 25.12 ± 0.24 versus 42.93 ± 0.51; F(1,42) = 285, P = 0.008 by one-way ANOVA. (D) The percentage of elongated mitochondria calculated by counting the elongated mitochondria and normalizing to the total number of mitochondria. Wild-type versus UQCRC1 p.Tyr314Ser; 9.8% ± 0.89% versus 35.12% ± 0.31%; F(1,42) = 1404, P = 0.007 by one-way ANOVA. (E) Irregularity of mitochondrial morphology was calculated as the number of turns in the outer membrane per mitochondria. Wild-type versus UQCRC1 p.Tyr314Ser; 2.12 ± 0.18 versus 3.05 ± 0.42; P = 0.021 by one-way ANOVA. n = 5 for each genotype; n = 20 images per group. (F) Mitochondrial fractions of tissue homogenates of substantia nigra and striatum from wild-type (n = 3) and UQCRC1 p.Tyr314Ser knock-in mice (n = 3) at variable ages were examined for complex III activity. There is a decrease of complex III activity in UQCRC1 p.Tyr314Ser knock-in mice compared to wild-type mice at the age of 7 months and 12 months. Wild-type versus UQCRC1 p.Tyr314Ser; 0.71 ± 0.01 versus 0.26 ± 0.04; F(1,4) = 15, P = 0.01 by one-way ANOVA for the age of 7 months; wild-type versus UQCRC1 p.Tyr314Ser; 0.57 ± 0.02 versus 0.25 ± 0.03; F(1,4) = 3.89, P = 0.08 by one-way ANOVA for the age of 10 months; wild-type versus UQCRC1 p.Tyr314Ser; 0.76 ± 0.08 versus 0.32 ± 0.04; F(1,4) = 11.13, P = 0.02 by one-way ANOVA for the age of 12 months. n = 3 for each genotype in individual ages. *P < 0.05, **P < 0.01.

