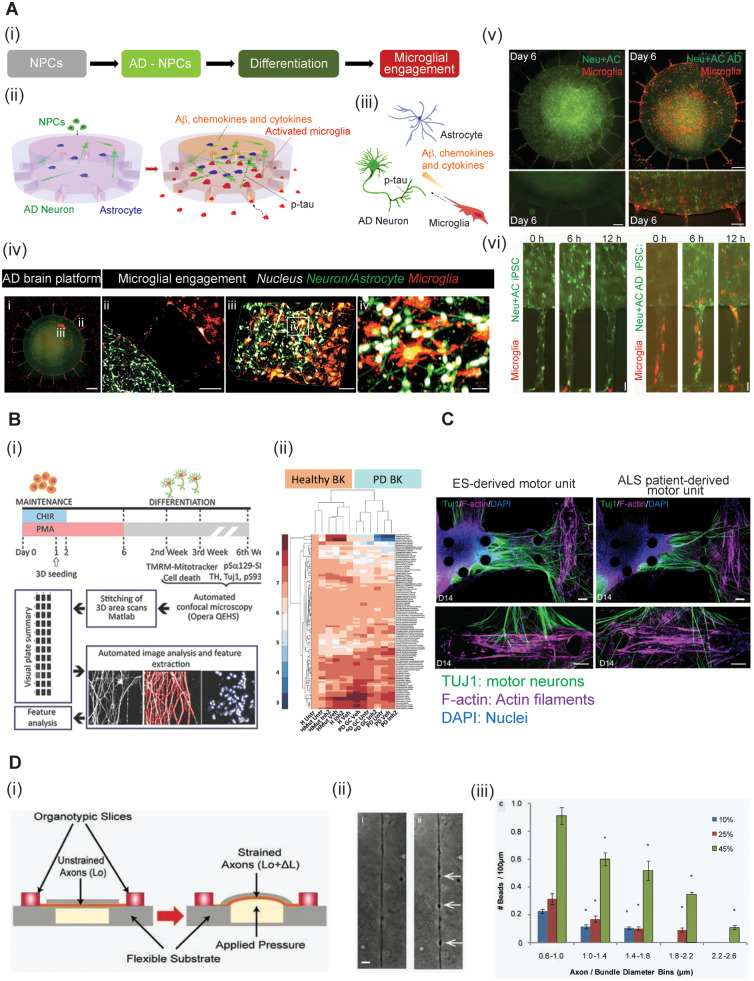
Figure 3.
3D engineered in vitro models for neurodegeneration and TBI. (A) A 3D organotypic human triculture model for Alzheimer’s disease (AD) (Park et al., 2014). (i) Neural progenitor cells (NPCs) were differentiated to Alzheimer’s disease neurons and astrocytes, while monitoring microglia recruitment. (ii–iii) Schematic of the multicellular interactions in the in vitro microfluidic AD model (ii) and in the AD brain (iii). (iv) Image i: Fluorescent image of the microfluidic platform. Alzheimer’s disease neurons (Neu)/astrocytes (AC) (green) are in the central chamber and microglia (red) are in the angular chambers. Scale bar = 250 μm. ii: Microglial recruitment across the angular microchannels. Scale bar = 250 μm. iii and iv: Confocal imaging confirms the 3D physiological intercellular communication among neurons (green), astrocytes (green) and microglia (red) in the central chamber. Nuclei are shown in white. Scale bars = 100 μm in iii; 40 μm in iv. (v) Comparison of microglial recruitment (red) by the control Neu + AC (green) and the AD Neu + AC (green). Scale bars = 250 μm (top) and 200 μm (bottom). (vi) Microglial recruitment by hiPSC AD Neu + AC. Scale bar = 10 μm. (B) 3D model of Parkinson’s disease (PD) dopaminergic (DA) neurons for high content phenotyping and drug screening (Bolognin et al., 2019). (i) Schematic illustration of the experimental procedure. The setup allows for automated image acquisition, segmentation, feature extraction and data analysis. (ii) A clear clustering of the lines according to genetic background is shown in the heat map. (C) A 3D ALS motor unit microfluidic model (Osaki et al., 2018c). The ALS motor unit (right) exhibits fewer thick neural fibres and decreased neuromuscular junction (NMJ) formation compared with the embryonic stem (ES) cell-derived motor unit (left). Motor neurons are stained with TUJ1 (green), actin filaments with F-actin (purple) and nuclei with DAPI (blue). Scale bars = 100 μm. (D) A brain-on-a-chip to model TBI. Schematic sketch of the uniaxial axonal strain device (i) an example of axonal beading observed before and after the strain injury (ii) and a bar plot representing the correlation between the diameter of the axon/bundle and the number of beads used to injure the cells (iii). Figure components are modified from Dollé et al. (2014), Osaki et al. (2018c), Park et al. (2018) and Bolognin et al. (2019) with permission.

