
Figure 9:
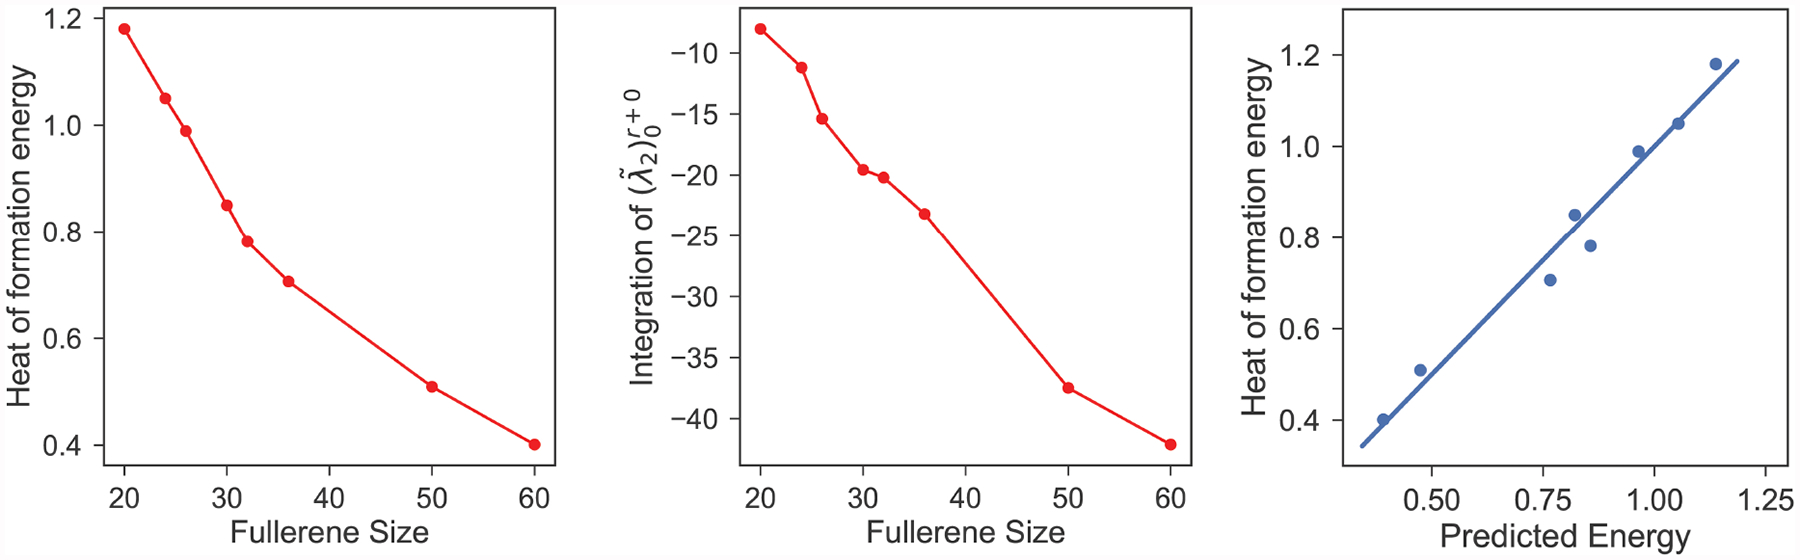
Persistent spectral analysis and prediction of fullerene heat formation energies. Left chart: the heat of formation energies of fullerenes obtained from quantum calculations [46]. Middle chart: PST model using the area under the plot of . Right chart: Correlation between the quantum calculation and the PST prediction using non-topological spectral analysis (α = Max).