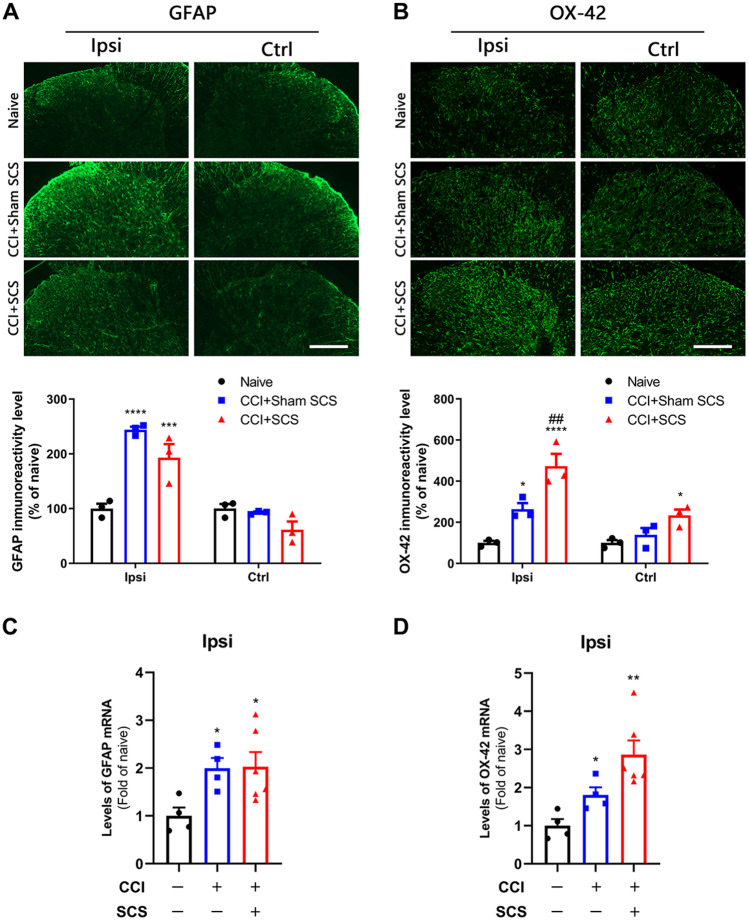
Fig. 2.
Changes in the immunoreactivity and mRNA levels of GFAP and OX-42 in the spinal cord after CCI and SCS. A Upper: representative images of GFAP staining in the dorsal horn ipsilateral (Ipsi) and contralateral (Ctrl) to the nerve injury. Lower: quantification of GFAP immunoreactivity in each group. B Upper: representative images of OX-42 staining. Lower: quantification of OX-42 immunoreactivity. Scale bars, 100 μm. C, D Levels of GFAP mRNA (C) and OX-42 mRNA (D) in the ipsilateral cord of the different groups. n = 3–6 rats/group. Data are shown as the mean ± SEM. *P < 0.05, **P < 0.01, ***P < 0.001, ****P < 0.0001 vs naïve; ##P < 0.01 vs CCI + Sham SCS; one-way ANOVA, with Bonferroni post hoc test.

