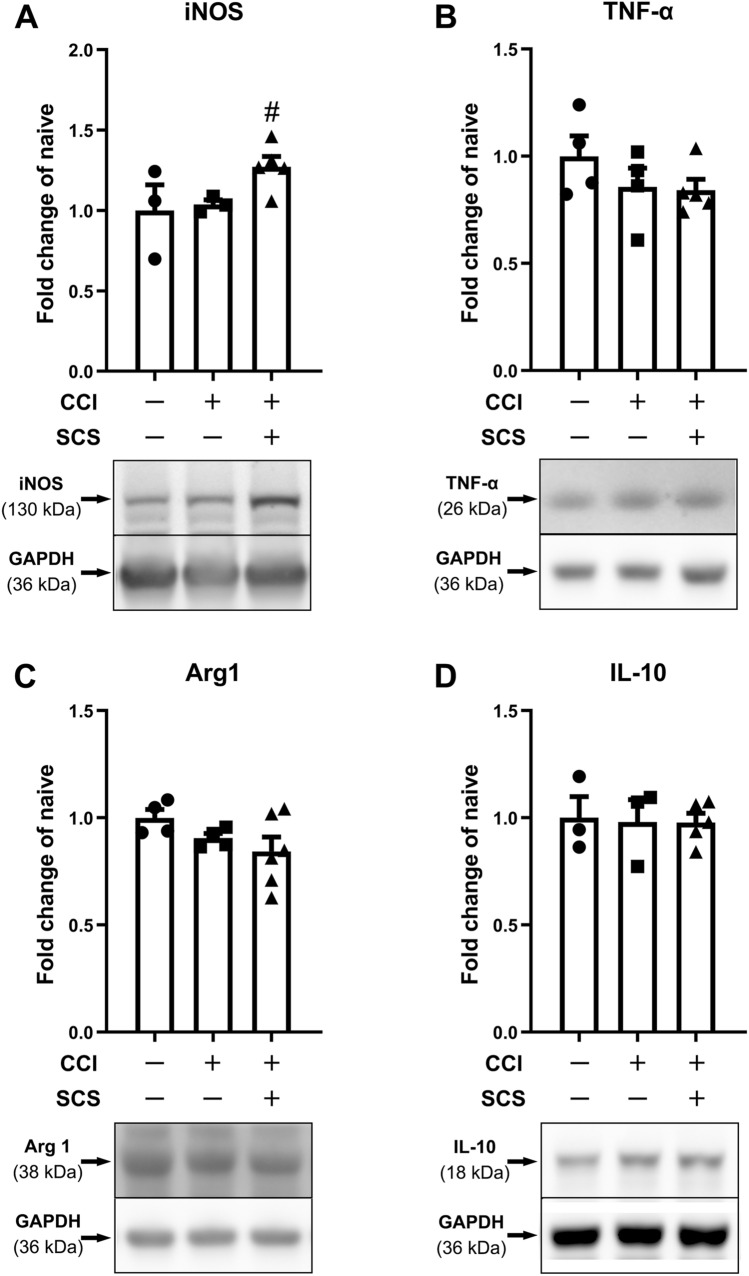
Fig. 4.
Changes in the levels of M1-like and M2-like microglial markers and related cytokines in the ipsilateral spinal cord after CCI and SCS. Quantification (upper) and representative immunoblots (lower) of (A) iNOS, (B) TNF-α, (C) Arg1, and (D) IL-10 in different groups. n = 3–6 rats/group. Data are shown as the mean ± SEM. #P < 0.05 vs CCI + Sham SCS; one-way ANOVA, with Bonferroni post hoc test.

