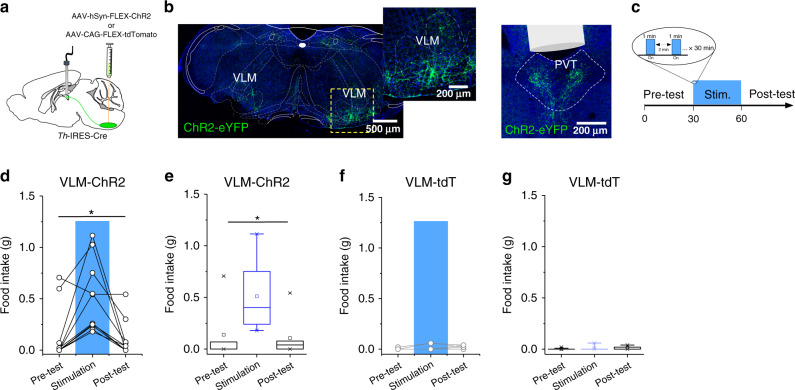
Fig. 2. Optogenetic stimulation of the VLMCA terminals in the pPVT results in robust feeding behavior in well-fed mice.
a Schematic of ChR2-expressing and control viral vector injections, as well as optical fiber implantation for optogenetic activation VLMCA fibers in the pPVT. b Representative image of ChR2 expression in the VLM of TH-IRES-Cre mice and ChR2-labeled terminals in the pPVT. c Schematic of the experimental design and the stimulation protocol used to measure feeding behavior during optogenetic stimulation of VLM terminals in the pPVT. Food intake was quantified in well-fed mice prior to, during, and after light stimulation (30 min, pre-test, stimulation, and post-test). The stimulation protocol consisted of 30 min in which light stimulation alternated between 1 min “light ON” (20 Hz) and 2 min “light OFF” bouts. d Plot of individual performance on feeding behavior during the pre-test, stimulation, and post-test for ChR2 (VLM-ChR2) mice. e Quantification of feeding behavior during VLMCA–pPVT stimulation for ChR2 mice. Total food intake in grams, ChR2: Pre-Test, 0.116 ± 0.07; Stimulation, 0.430 ± 0.11; Post-Test, 0.115 ± 0.05, n = 12 mice; F(2,33) = 5.12, one-way ANOVA followed by Tukey’s test. Group comparisons: Pre-Test vs Stimulation, *P = 0.02; Post-Test vs Stimulation, *P = 0.02. f Plot of individual performance on feeding behavior during the pre-test, stimulation, and post-test for control (VLM-tdT) mice. g Quantification of feeding behavior during VLMCA–pPVT stimulation for control mice. Total food intake in grams, Control: Pre-Test, 0.002 ± 0.01; Stimulation, 0.012 ± 0.03; Post-Test, 0.012 ± 0.02, n = 10 mice; F(2,27) = 1.04, one-way ANOVA followed by Tukey’s test. Group comparisons: Pre-Test vs Stimulation, P = 0.44; Post-Test vs Stimulation, P = 1. Box chart legend: box is defined by 25th, 75th percentiles, whiskers are determined by 5th and 95th percentiles, and mean is depicted by the square symbol. Data presented as mean ± SEM.

