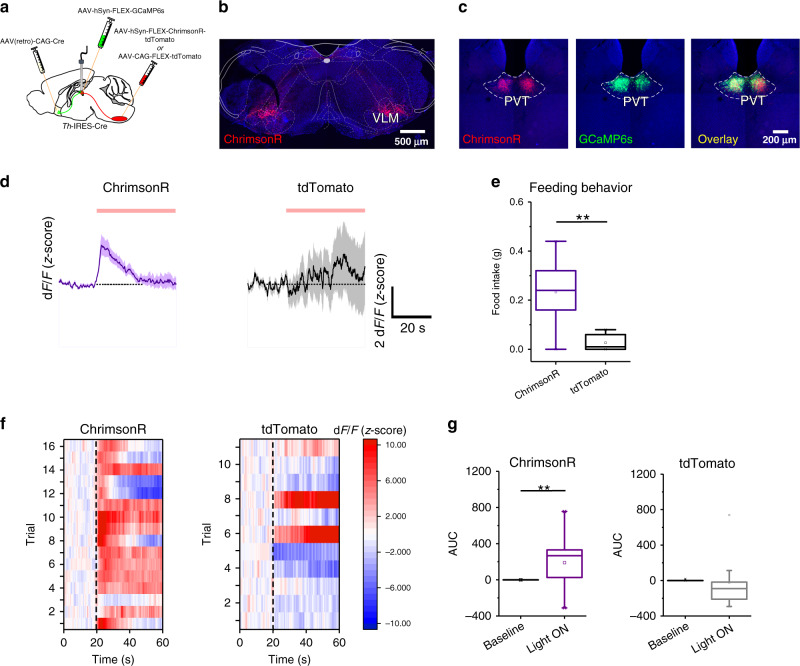
Fig. 3. Photostimulation of VLMCA axonal inputs to pPVT increases the activity of pPVT–NAc neurons.
a Schematic of the viral vector strategy and optical fiber placement used for selectively expressing GCaMP6s in NAc-projecting neurons of the pPVT and red-shifted channelrhodopsin-2 (ChrimsonR-tdTomato) in catecholaminergic neurons of the VLM of TH-IRES-Cre mice. b Representative images from a TH-IRES-Cre mouse expressing ChrimsonR-tdTomato in the VLM. c Representative images of the pPVT showing axonal projections from the VLM (ChrimsonR-tdTomato; left), GCaMP6s expression in pPVT–NAc neurons (middle), and overlay image showing colocalization between the projections from ChrimsonR-expressing VLM neurons and GCaMP6s-expressing pPVT–NAc neurons (right). d Average GCaMP6s responses from pPVT–NAc neurons in ChrimsonR-expressing (purple) and tdTomato-expressing (black) animals subjected to light stimulation. e Quantification of food intake during VLMCA–pPVT stimulation for both ChrimsonR and tdTomato showing increases in feeding after stimulation in well-fed ChrimsonR expressing mice. Total food intake in grams, ChrimsonR, 0.23 ± 0.05, n = 9 mice; tdTomato, 0.03 ± 0.01, n = 6 mice; two-sided Unpaired t-test, **P = 0.006. f Heatmap showing individual trial GCaMP6s responses to light stimulation (561 nm at 20 Hz) from both ChrimsonR-expressing and tdTomato-expressing (control) mice. g Left: Quantification of light-evoked changes in GCaMP6s fluorescence in pPVT–NAc neurons from mice expressing ChrimsonR in VLMCA neurons. Area under the curve (AUC), Baseline, −0.21 ± 0.11; Light ON, 190.65 ± 63.27; two-sided Paired t-test, **P = 0.008. Right: Quantification of light-evoked changes in GCaMP6s fluorescence in pPVT–NAc neurons from mice expressing tdTomato in VLMCA neurons. Area under the curve (AUC), Baseline, 1.78 ± 1.83; Light ON, −23.13 ± 99.86; two-sided Paired t-test, P = 0.79. Box chart legend: box is defined by 25th, 75th percentiles, whiskers are determined by 5th and 95th percentiles, and mean is depicted by the square symbol. Data presented as mean ± SEM.

