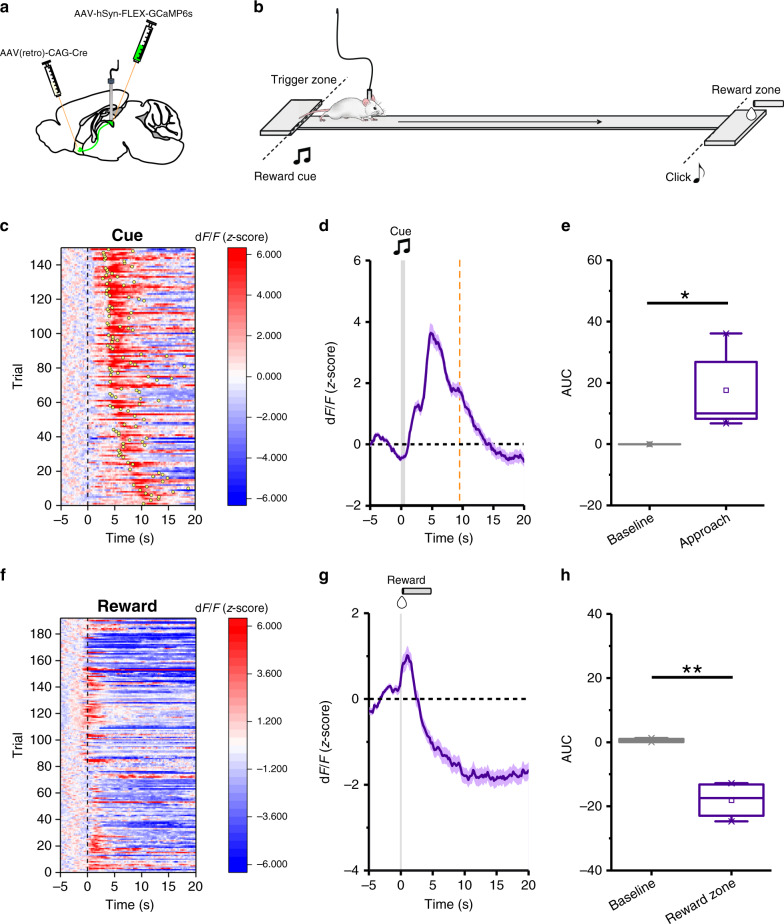
Fig. 4. The activity of pPVT–NAc neurons increases during food-seeking behavior in hungry mice and decreases during feeding.
a Schematic of the viral vector strategy and optical fiber placement used for selectively expressing GCaMP6s in NAc-projecting neurons of the pPVT. b Schematics of the reward foraging task. To initiate a trial, mice awaited in the trigger zone for an auditory cue (8 KHz, 1 s) which signaled reward availability. Mice then ran to the reward zone to retrieve a liquid food reward. c Heatmap of GCaMP6s responses from pPVT–NAc neurons during performance of individual trials of the foraging task. GCaMP6s responses were time-locked to cue onset and trials were sorted by latency to complete a trial. Yellow dots represent first nose-poke into the food-port. d Average GCaMP6s responses from pPVT–NAc neurons during the foraging task. Gray bar indicates the delivery of auditory cue during trial initiation. Trial inclusion criteria was set to trials performed under 10 s noted by the red dotted line. e Quantification of the changes in GCaMP6s fluorescence in pPVT–NAc neurons during the onset of trial performance in the foraging task. AUC, Baseline, −0.05 ± 0.02; Approach, 17.58 ± 5.87; n = 5 mice, two-sided Paired t-test, *P = 0.04. f Heatmap of GCaMP6s responses from pPVT–NAc neurons during feeding bouts in the foraging task. GCaMP6s responses were time-locked to first nose-poke into the food-port. g Average GCaMP6s responses from pPVT–NAc neurons during feeding bouts in the foraging task. Gray line signals first nose-poke into the food-port. h Quantification of the changes in GCaMP6s fluorescence in pPVT–NAc neurons during the onset of feeding in the foraging task. AUC, Baseline, 0.52 ± 0.31; Approach, −18.08 ± 2.91; n = 4 mice, two-sided Paired t-test, **P = 0.008. Box chart legend: box is defined by 25th, 75th percentiles, whiskers are determined by 5th and 95th percentiles, and mean is depicted by the square symbol. Data presented as mean ± SEM.

